Unusual earthquake swarm south of Bend, OR
NOTE: Update as of 10/26/2015
Any change in seismic activity increases our vigilance should the change develop into something threatening. This ongoing earthquake swarm southwest of Bend, Oregon, is just the sort of thing to trigger such vigilance. Because of the proximity of young volcanic vents in the area the Cascade Volcano Observatory is also taking an interest and as of today is installing an additional seismic station near the swarm. Currently the nearest station, (SWNB) is 33 km away so both our detection threshold and our location accuracy (particularly for depth) is degraded.
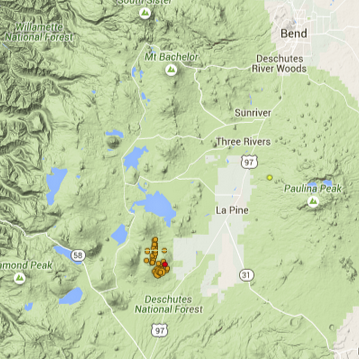
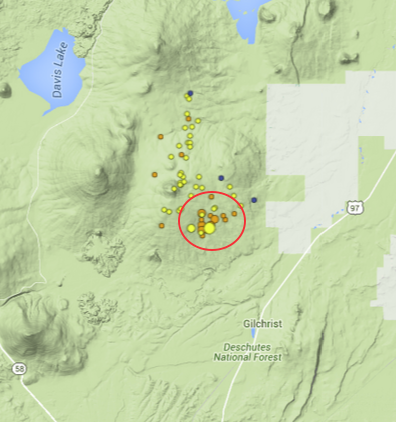
As of noon on Oct 23 there have been 36 events located in this swarm (and several more small events--too small to be located--can be seen on the nearest sensitive seismic station). Here is a map of the event locations with some background geography for reference. Note that the event locations are elongated in the north-south direction by about 10 km. Because of the similarity of seismic waveforms from these events we do not think that this pattern is real but is rather an artifact of the poor station coverage and weak signals for many of the events. The reported depths of these events range from very shallow (~1 km) to fairly deep (14 km). Again this variability is probably not real but rather an artifact of not having good depth control because no station is closer than 33 km. Based on signal character we think these earthquakes are fairly shallow; perhaps around 5 km depth or less. The installation of a nearby station should help resolve this issue (assuming the swarm continues).
Here is a figure showing the earthquake magnitude distribution over time. The reason we call this a swarm is that it did not start with the largest event but rather the largest magnitude (so far) occurs after quite a few smaller events.
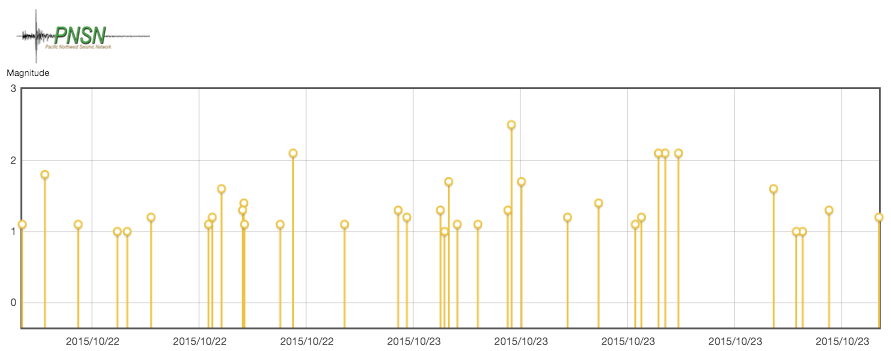
At this point our detection/location threshold for earthquake magnitude is about M=1.0. With an additional nearby station the detection threshold will go to much lower magnitude; however the location threshold may only improve by a little bit because it takes at least 4 good phase pick times to get even an approximate location.
So what is going on? At this point we don't know the cause of this swarm. However, it is not totally unique. There were similar swarm, perhaps with larger sized events in both 2001 and 2012 and in both cases the seismic network had far fewer stations so many events of the same size we can located today were totally missed in those previous swarms. Swarms like this are also fairly common in the Basin and Range tectonic area of eastern Oregon and Nevada. In fact there has been a long lasting and much more intense swarm going on just across the border in Nevada (Shelton Antelope Range swarm).
There are many mapped earthquake faults in the region as well as some recent (less than 7,000 years ago) volcanic vents. A large earthquake in this area is always a possibility or even a volcanic eruption. However, at this time both of these cases are considered very low probability events.
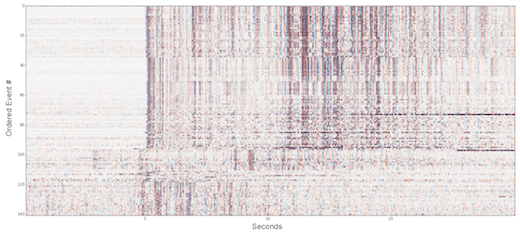
More evidence that the disbursed locations in the catalog are wrong is provided by Alicia Hotovec-Ellis who analyzed the continuous waveforms from one station looking for signals with the same characteristics. If earthquakes are spread out in space then the seismograms recorded from them should all look different because of the different paths they take from source to station. Thus if waveforms from different events all look very similar it indicates that the earthquakes must be from near the same place and have the same source motion. Alicia taught her computer to search for similar waveforms within 5-second windows for the period starting yesterday morning and then plot each waveform in a "wiggle-plot" format aligned on the first part of the common signal.
Plotted here are the 140 detected waveforms, plotted so that red/blue correspond to up/down motion. Thus the vertical stripes of those colors are where peaks and troughs line up well over many events. They are ordered so that similar earthquakes are near each other vertically. There are several groups where the waveforms are nearly identical from the top down for about 95 events. From 95 to 140 events may have similarities but either because of their small size or noise in the data they are not nearly so obvious. The similarity seen here is only possible when the earthquakes are close together, probably within one kilometer of each other, thus confirming the spread in our locations is not real.
The Cascade Volcano Observatory (CVO) has its own information statement about this activity. This information "blog" will be updated as new information or interpretations become available.
Update as of 10/26/2015
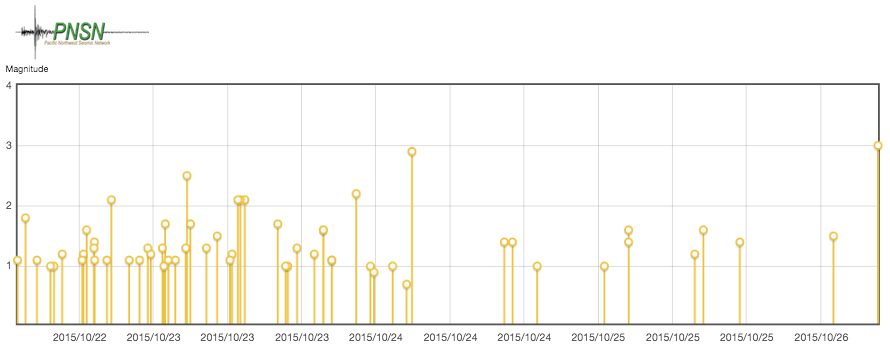
With a great deal of extra effort, staff from the Cascades Volcano Observatory (CVO) dashed to the field over the weekend and installed two new seismic stations in the epicentral area of this swarm. THANKS CVO STAFF!!! By Saturday evening data from these stations were being recorded at the PNSN and routinely processed along with all other data. Unfortunately (or fortunately depending on if you like earthquakes or not) the swarm also became much less active. Even with these two new stations few additional earthquakes are now being detected and located. The following figure is an updated version of the time versus magnitude plot for the whole period. Note that the plot ends with a magnitude=3.0, the largest event of the sequence last night. Since then, no events have been detected large enough to be located and very few tiny events can barely seen on the nearest station.
The last several of these events were recorded on the new stations and now give us good depth control. All of these events locate between 7 and 8 km with the better recorded ones at about 7.4 km depth. As mentioned above the depths of events before these new stations became available are not to be trusted. My guess had been that they were less than 5 km deep based on waveform character. Bad guess! The crustal structure in the region must makes the waveforms look (to the eye) as if they are coming from a shallower source. So, based on these latest locations and the cross-correlation work mentioned above by Alicia we now think that probably all the events are located within the red circle on the following map at a depth of about 7.5 km plus or minus 0.5 km.
Based on the first arrivals from the M=3 earthquake last night we can compute a focal mechanism, shown below. The fit to these is fairly well constrained but does leave quite a bit of slop for the major compression axes. A north-south horizontal major compression axis (P-axis) is common throughout the Pacific Northwest while in the Basin and Range province the P-axis is more typically near vertical. This mechanism may be somewhere in between though there is lots of wiggle room.
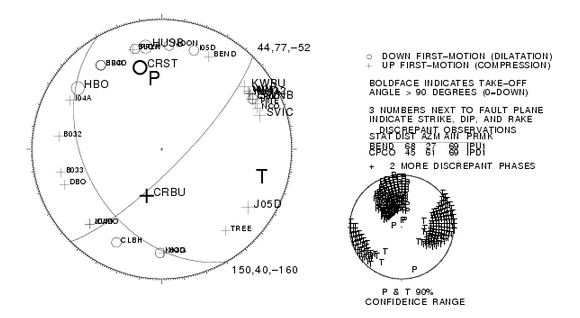
The combination of the event depth, character and focal mechanism now allows for a better interpretation for the source of this swarm. The oblique slip nature of the mechanism and depth is quite consistent with the predominant tectonics of the region. David Sherrod of CVO and Ian Madin of DOGAMI both point out that the mechanism is consistent with the local tectonics and mapped faults, several of which have a NE-SW strike similar to one of these planes. Thus, while a volcanic injection event can't be totally ruled out our preference is for a regular run-of-the-mill, east-of-the-Cascades type tectonic swarm.
Probably end of story.... but if something changes, more will be posted.