RSAM Plots
Realtime Seismic Amplitude Monitor (RSAM)
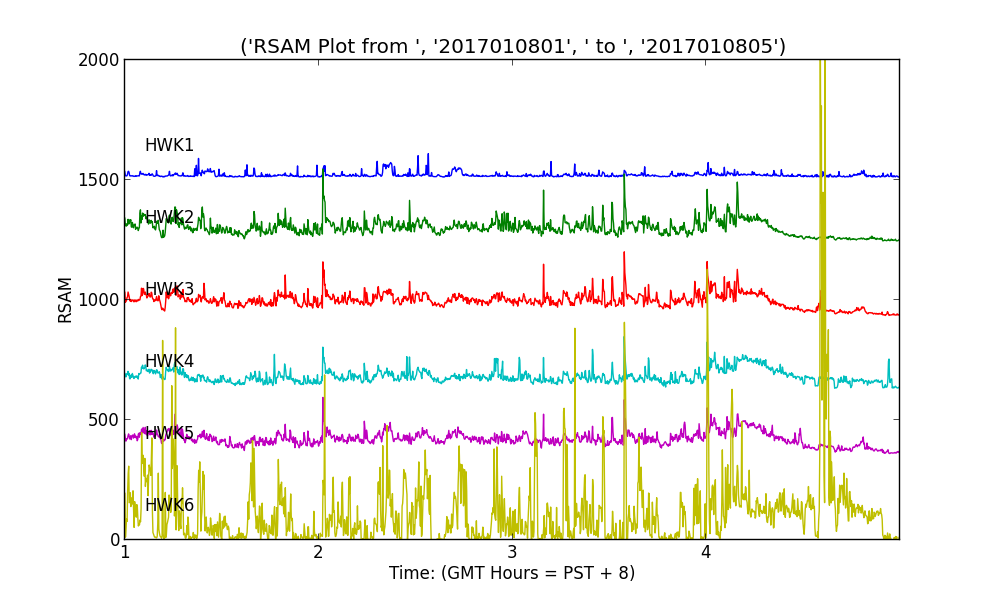
An effective way to summaries seismic data from several stations over time is RSAM plots. These are made by plotting the equivalent of the envelope of seismic signals over time. More specifically the technique is to filter, rectify and sum over a fixed time and plot these values for each station with increasing time (left to right). These types of plots are particularly effective for monitoring seismic activity associated with volcanic unrest or very active earthquake sequences. The averaging time for these cases is usually 30 seconds. For monitoring a football game an averaging time of 10 seconds is more appropriate.
For the Seahawks-Lions game shown below the vertical channels of the six HWK stations (see Map of sensor locations) are shown ordered top to bottom (1-6). The different colors are only to aid the eye in separating traces. Note, the signal for HWK6 (bottom trace) has been divided by 5 since this sensor is located high in the north end of the stadium where motions are extra large, even without fan action.