The final football game analysis
Seismic analysis of the NFC championship game betweenthe Seattle Seahawks and San Francisco 49ers
Not too surprising is the observation that the large increase in web page interest seen during the previous game against the Sanits was less dramatic this time. The novelty of seismic data from a foot ball game is probably wearing off. While for the previous game our counters showed over 100,000 page views we know that about half of these were from the failed "Fan-O-Meter" that people would try over and over again to try and make it work. This time we had almost 42,000 page views and because the Fan-O-Meter was working well, those using it had only to go to it once to watch the seismic traces with only a few seconds delay from real time. A Microsoft bunch of techies came up with a cool way to help us. See below for why it worked so well. There were over 6,000 different visitors to our pages, only about 2/3rds as many as for the previous game. The increase in social media interest for our Facebook (thePNSN) and Twitter (@PNSN1) offerings were also down some but both still had an increase of about 20% in followers.
Most all of our web offerings worked well during the game. The only glitch was the Hawk-O-Grams stopped updating at 6pm, before the game was over because of a logic error in the page layout. It was caught and fixed at about the time the game ended. One of our staff, Angel Ling did a wonderful job of annotating the seismograms shortly after important plays. This can be best seen on the HWK2 Hawk-O-Gram which seemed to have the clearest response to crowd actions. The permanent seismograph, KDK, on which the original Beast Quake in 2011 was detected also shows many of the big plays but because it is also shaken by nearby vehicle traffic it is harder to interpret every wiggle.
A frequent question by many, including the press, is what is the biggest Beast Quake? While these cannot be compared to earthquakes we can compare one to another. Paul Bodin plotted up the three biggest Beast Quakes for which we have good recordings (probably the biggest ever). It is clear that the original is still the largest . But after being down by 10 points for quite a while and only getting a field goal to start the come back, Lynch's TD in the third quarter caused a crowd reaction that generated a contender for the number one spot, only falling slightly short.
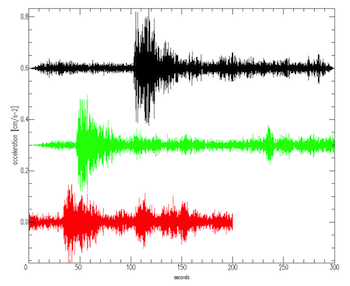
In the figure to the left the original 2011 BQ is in black, the Jan 11 game against the Saints biggest BQ is in red and the one this game is in green.
While not true BQs (inspired by Lynch TDs in beast mode) the late fumble recovery and last minute interception came very close to the same level of crowd response. Additional analysis will be needed to put a relative ranking on all of these.
Now for some real science
We have been puzzled by a strange low-frequency, fairly constant, almost single frequency signal seen and reported after several touchdowns in the past. The unusual character of these signals can not be seen on the web-available seismograms such as the Hawk-O-Grams, Fan-O-Meter or Fan-O-Meter2 but can be seen using seismic waveform processing techniques that allow one to look more carefully in both the time domain (seismic traces) and frequency domain (spectrograms). While the analysis and coordination with notes taken by observers is still going on we speculate that these signals are due to music being played over the stadium PA system that causes the fans to dance or sway in unison. John Vidale reports: "I'm leaning toward the harmonics being either directly or indirectly caused by songs played on the sound system. The "tones" would be caused by the beat of the music, ~100 beats/minute, and its first harmonic. The variation of frequencies could be when different songs are played, and the repetition during the Dec 11 Saints game could be from playing the same song one to two minutes after each touchdown just during that game."
Those of us watching on TV would not know about this because this music was almost always only played during TV commercial interruptions. We will report more on this topic here in this blog as the mystery is further unraveled.
OK, a day later and some additional analysis has further confirmed the above hypothesis but there are still some lingering questions. We are hoping to get a detailed film or at least soundtrack for the whole period including when the TV broadcast went away to really put a nail in the coffin. In any case the figures presented here show good evidence that the low-frequency, single-frequency signals (called DanceQuakes from here on) are due to dancing fans. These DanceQuakes never occur during big plays. Beast Quake like signals are very broadband and look to be due to much more random motions of the fans, not coordinated. Some of the Beast Quake signals are really big but don't last as long as the DanceQuakes and have lots of signal at all frequencies, particularly between 1 and 15 Hz. I have searched the whole game and only find the DanceQuakes with strong signals minutes after a big play or at half time or after the game. The figures here present the best examples.
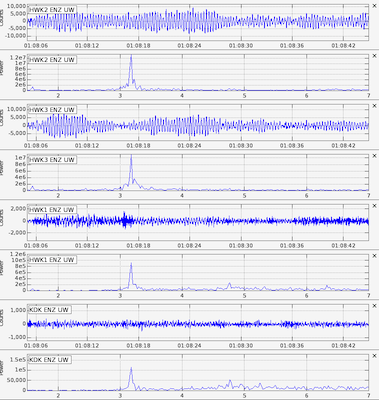
Each figure shows a seismogram and a FFT frequency plot (on a log-linear scale) of the data from each of the four stations. These frequency plots show the strong peak at each station is pretty much at the same frequency, but for different time periods that frequency changes. (click on a figure to get a blow-up)
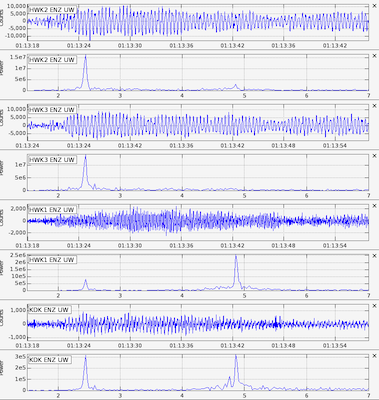
Before the half time break there was only one period, about three minutes after the Hawk's field goal that showed any hint of a DanceQuake. However during the half time period there were two very strong DanceQuakes, the first (shown in top figure) lasted about 1 3/4 minutes and then was followed by a second DanceQuake shortly thereafter that lasted for almost four minutes. The strongest signal shifted between 3.2 Hz for the first DanceQuake to 2.4 Hz for the second. Something strange that we don't understand at all yet is the appearance of a strong higher frequency at 4.8 Hz near the end of the second DanceQuake, but only on the two ground level instruments (HWK1 and KDK) (shown in the second figure).
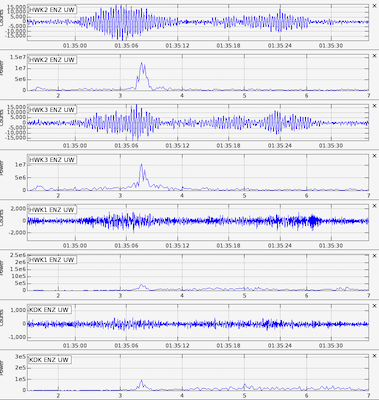
The third figure shows the Post-BeastQuake DanceQuake; that is it starts about 1 1/2 minutes after the Lynch touchdown run. This DanceQuake only lasts about 30 seconds and its not quite as sharply peaked as the previous and any possible higher frequencies are not so obvious. Subsequent big plays did not seemed to be followed by obvious DanceQuakes though in some cases there is a hint of one.
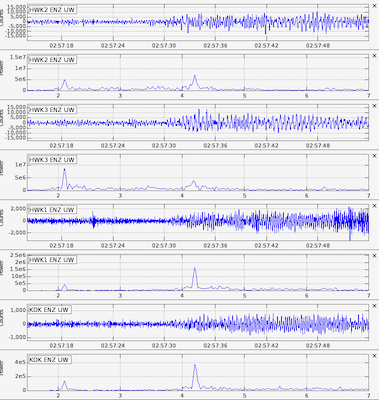
While there was a DanceQuake (not shown here) just at the end of the game it was similar to the one at the end of the half time show but only lasted about 20 seconds. The final figure shown here is for a DanceQuake about five minutes after the game was over. It lasted less than a minute but is characterized by two frequency peaks at all stations (2.1 Hz and 4.2 Hz).
Thus, for the most part we think we have the DanceQuake signal figured out. It seems to figure that the random jumping and cheering associated with a big play would generate a broadband spectrum while fans moving, dancing, even just fott tapping all in sync with the music would generate vabrations at a single frequency. A time-stamped recording of everything that was going on would totally confirm. The only question left is why the lower level instruments sometimes show a higher frequency peak and sometimes not..... and what about the very last DanceQuake where all instruments showed this peak. I think we will leave this an an exercise for the reader.
The Fan-O-Meter experiment
As many may know the original Fan-O-Meter for the Jan 11 game was a flop. It seemed to work fine for one or two connections but when large numbers tried it would randomly freeze and stop displaying for everyone and allow no new connections. The code was designed for only a few connections in a research mode and so failed. We were giving up on it ,and thus started the Fan-O-Meter2.
Then we heard from a group of hot-shots over at Microsoft who wanted to try to solve the live feed problem. Here is a report (pretty detailed) from them along with a graph showing how well their solution worked.
After reading about technical issues impacting the work by UW scientists to track seismic activity during Seahawks games, three Microsoft employees asked if they could volunteer to help. Under a tight timeline with partnership from UW scientists, Nik Garkusha, Cory Fowler, and Jose Miguel Parrella donated their time to build a scalable solution that can help handle the real-time monitoring requirements during the game.
Using the Windows Azure cloud service the Microsoft team scaled the solution to support over 2,750 connections, using a Virtual Machine running Linux & Node.js to consume the real-time data stream from UW server and then re-broadcast the data over the Windows Azure network. With a total cost of less than six dollars ($6.00) for running the solution over 24 hours, this made for a very compelling solution that scaled up when the network bandwidth peaked at gametime, and scaled down when the compute capacity wasn't needed. The code used in this project will be made available as Open Source on GitHub for other seismic experiments requiring real time data feeds supporting massive scale.
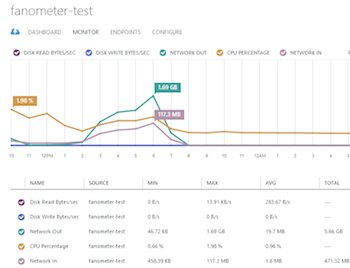
Here is a graph showing traffic through the Microsoft mirroring system of our Fan-O-Meter feed. We don't understand the details but were super pleased that it worked so well. It just goes to show you that a failed experiment is not always a bad thing. It can generate new and better solutions. THANKS MICROSOFT!