Seismic Game Analysis
We hope that hawk-a-mania doesn't let people forget that Western Washington and Oregon are subject to real earthquakes (in contrast to Beast Quakes) which are due to slip on underground faults and all should have some emergency preparations in anticipation of the next real one.
There were several motivations for the PNSN to make some effort at studying the seismic activity related to an important local sporting event. One motivation was to to join in the fun of Hawk-o-mania doing things we know how to do and maybe providing some fun and information to others. Four of us sat around a TV in the PNSN labs taking notes on what we saw on TV, which had ~10 second delay from realtime). We discovered that as a play began we could predict if it would result in something good for the Hawks by watching signals on the seismograph. Crowd reaction would show up on our realtime seismic traces before the TV would show what happened. Interesting.
A primary motivation for this experiment was to run the "fire drill" for quickly installing portable instruments, getting the telemetry set up and doing some special analysis, something the PNSN must do following a significant earthquake (which we have not had in the past few years). For the most part this went really well. The technical crew did a great job of getting needed permissions, installing the equipment setting up two different telemetry paths and configuring data into the PNSN analysis systems. One thing we learned is that it's important to investigate installation sites in lots of detail. The site HWK1 looked to be a good site providing good data for the first 24 hours. However, early on game-day very strong and continuous noise signals showed up on HWK1. It took a bit for our technical staff to track down the source, which turned out to be a large motor that was switched on as part of the stadium ventilation system. It was too late to move the station and so we had this 45 Hz noise going for the whole game. Too bad, but the crowd actions mostly generated signals at lower frequencies and so could be filtered out in post game analysis. See below.
Another motivation was to try to provide some realtime data to web site visitors to provide immediate feedback. This was only a partial success. Of two technologies we used only one of them could reliably provide information to the public. The realtime feed (named the Fan-O-Meter) very quickly became saturated by requests and failed for most users. Looking at our connection statistics as many as 250 people at a time would try to connect and we could tell that at most 20 of them would get a feed and even for them it would often fail after a minute or two. Because of the obvious frustration this sort of response could generate we turned it off in the third quarter. However, a private version of it running within the PNSN turned out to be very useful for associated crowd reaction with seismic signals. As mentioned above we could tell from these signals something about what we were about to see on TV some seconds later.
On the other hand the other realtime signals we provide (called the Hawk-O-Grams) worked quite well and provided interesting views of seismic activity in NEAR realtime. We have frozen copies of the Hawk-O-Grams for the Saint's game from Jan 11. Since these images were updated every 20 to 40 seconds one could only see signals that were older than ~30 seconds which made them slightly harder to interpret in terms of crowd reaction.
A major motivation for this experiment was to test the PNSN web site ability to handle big increases in traffic, which it did very well. As near as we could tell from the statistics produced by the system, it's use jumped by a factor of 4 over its normal daily traffic with over 100,000 page hits on game-day. There were 12,500 visits from 9,500 different people compared to an average of about 3,000 visits from 2,000 individuals. Two thirds of the visits were from people never having visited the PNSN web site before. We hope their experience was good enough that they will come back when interested in earthquakes or volcanoes. Regarding individual pages requested, unfortunately the Fan-O-Meter was the number one requested, probably because when it didn't work it was requested again and again. Thus this metric probably reflects the failure of this page rather than true interest. The second most popular page was the Hawk-O-Grams and then the main Seahawks page. Regular earthquake information was down the list during the game but still more than on an average day.
A results we were not expecting was the large increased use of the PNSN related social media. Our Twitter feed (@PNSN1) jumped from 400 followers to 1800 over the course of the day and our Facebook group (thePNSN) had over 100 new people join. During the course of the game we tweeted and put out comments on Facebook and our own comment area and added a few figures to each of these services. (some of which are reproduced below). There are several things that we learned from reading comments from others including confusion over the difference between audible noise and seismic noise and why we don't report magnitudes for Beast Quakes. We now have an extensive Frequently Asked Questions section that we hope people will look at before asking the same questions again.
Now for some fun stuff. Here is an annotated Hawk-O-Gram for the Saints game afternoon.
The annotations here are based on notes taken during the game while watching TV and the seismographs (thanks Kelly Hall for this). We have copies of all Hawk-O-grams from this game.
We can also compare records for the 2011 (original Beast Quake) with the final Beast Quake of the game today recorded on the same instrument (KDK) located just outside the stadium.
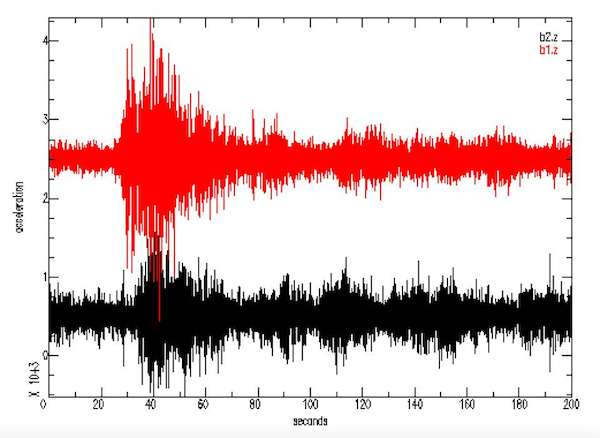
Paul Bodin generated this plot comparing the two and says: "Station KDK has spoken. BeastQuake 1 (2011), red in the figure, was both larger and lasted longer than BeastQuake 2 (2014), black in the figure. But not by a huge amount. At most a factor of two in both. And there are intriguing similarities in the post-score wiggles. We hypothesize they are extra point kick, and replay of run on the jumbotron at the stadium."
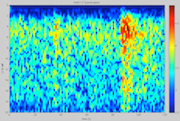
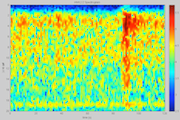
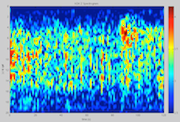
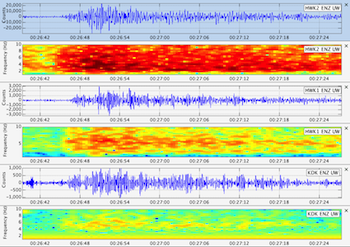
Spectrograms are graphs showing energy level at different frequencies over time. Here are those for our three stations during a Beast Quake in the first quarter. John Vidale says: "Clearly the upper deck is noisiest, inside the stadium is intermediate, and the station outside is weakest, and all 3 record the crowd generated vibrations clearly. The vertical axis is Hz, horizontal axis is time, color scale is log base 10. Now for a science issue - we've seen the stomping crowd reverberate at the nearby seismometer KDK with 2Hz and 5Hz energy, and blamed resonance of the stadium. However, it may be that that the entire SoDo neighbor tends to vibrate strongly with those frequencies, due to the very soft upper 20m of ground, which would have implications for the downtown hazard.
Art Frankel of the USGS pointed out that during the 2001 Nisqually quake there were big shakes at 2.2 Hz as was predicted by from geology - The bigger peaks in the spectral amplitude plot at 2.0 and 5.5 Hz illustrate this point. Solid lines are for the actual shaking recorded in SoDo and dashed that predicted from the geology.
Here are a few of the realtime plots generated internally in the PNSN (where the realtime Fan-O-Gram worked pretty well).
Here is a view of all three stations (vertical channel) of the Seahawk's first touchdown. High background from a motor running somewhere under the stands makes it less visible on HWK1; its obvious on HWK2 and can be seen on KDK (along with some local traffic signals.
In the fourth quarter Seahawks almost had an interception and the crowd gave a big roar and then quickly quieted down. They probably suddenly stood up and then sat back down too which is what we recorded.
Beast Quake number next. Second touchdown. This is the biggest signal of the day. .
Game over call announced because of illegal forward pass.
OK. Bring it on, next week.
Remember to check our FAQ if confused by any of this.
Some more post-game analysis
OK, a few days after the game and we are still looking at some of the data and have noticed something strange that seems to occur after each touchdown.
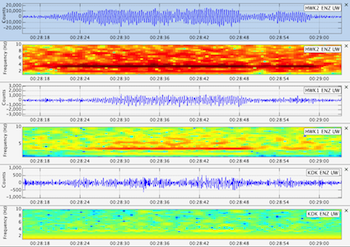
The first figure here shows seismograms and accompanying spectrograms for our three stations during what we call BeastQuake-2 (2nd touchdown on Jan 11). Obviously BQ-1 is the original BeastQuake from the tremendous Lynch run late in the Saints game of 2011. The second figure shows the same sort of plot, scaled the same for a time period a couple of minutes later. This shows a shaking almost as strong as during BQ-2 but has a very different character. Rather than fairly random sort of signals as during BQ-2 this post-TD signal has a very regular sinusoidal shape. We are curious what this could be.
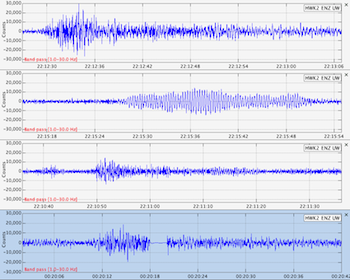
Another way to look at this is to compare the signals just at one station, the best one, HWK2 for several different times.
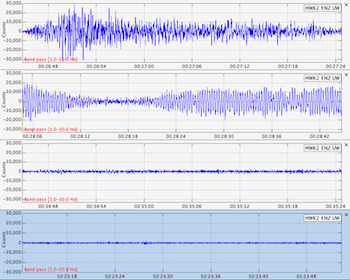
The top trace is the BQ2 at HWK2, the second trace is the post-BQ2 strange signal, the third trace is just the average crowd motion when nothing interesting is going on and the fourth trace is a couple of hours after the game when everyone had left the stadium. All traces are scaled the same. The vibrations generated by fans in the stadium is only about a factor of 2 greater than when no one is there. But when excited by a touchdown the generated Beast Quake (and its "aftershocks") is about 20 times bigger than that. It is still nothing compared to a real earthquake but still interesting.
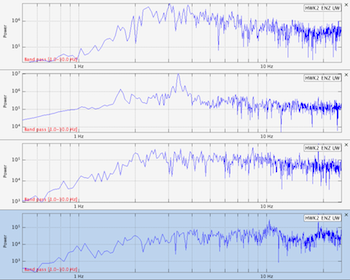
The following figure is getting a bit technical. It shows fourier spectra for the same four traces. This plots amplitude verses frequency content on log-log plots. What it tells us is that the BQ-2 itself has a fairly flat spectrum between 1 and 10 Hz (cycles-per-sec) but the strange post touchdown signal (2nd trace) has a very strong and sharp peak at about 3.4 Hz. Like the seismograms above plot 3 and 4 for average vibrations with and without the crowd respectively shows a very flat spectrum (white) from 1 Hz up, though the average level is about a factor of two higher for when the crowd is there.
What about other big events during the game such as the first touchdown. This figure shows the BQ associated with the first touchdown (top trace) and its strange vibrations a couple of minutes later (next trace down). We searched around all of the other interesting large vibrations during the game and could fine no other times that had the strange reverberations seen after the TDs. Trace three is the crowd reaction to the Seahawks fumble recovery shortly before the first touchdown and the bottom trace is the crowd reaction to the Sait's missed field goal near the end of the game.
By the way, we have heard some complaints about the UW and PNSN wasting time and resources (and tax payer money) on such frivolous things as football game seismology. While lab personnel have been involved with this effort mostly it is for development, training and practice for what they will need to do for real sooner or later. Analysis has mostly been done by students as part of their studies of seismic processing techniques. However, saying the effort to generate figures and write and format the web pages are part of our normal duties would be a stretch. So how can that be justified in a tight budget? Just don't pay me. The author of these web offerings is the retired, former director of the network who now mostly just "plays" being a seismologist and doesn't get paid for this sort of effort. So, if you don't like these web pages, you are just getting what you pay for, ie nothing.