Snow Avalanches at Mount St. Helens - Again
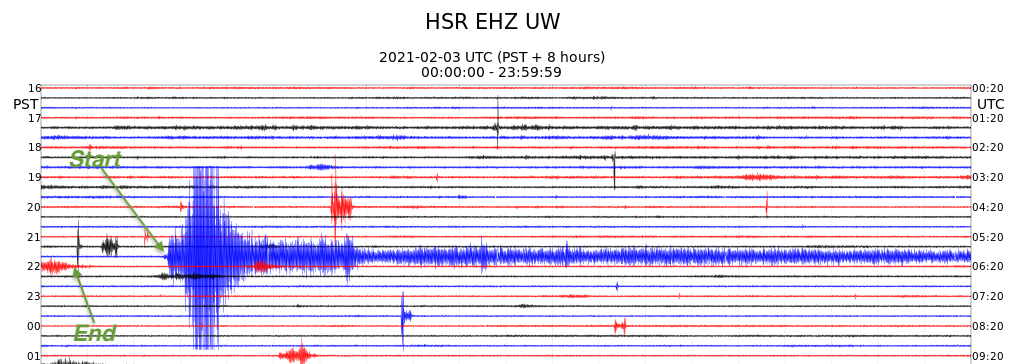
With the warm storm systems going through Washington in the past few days generating lots of snow up high, again Mount St. Helens has shed some avalanches big enough to be well recorded by the seismic monitoring system. Wes Thelen, a seismologist at the Cascades Volcano Observatory (CVO) called my attention to the seismic records that clearly show long lasting surface events. It is clear based on the timing and amplitudes that these events took place on the east side of the volcano, probably starting up high near the crater rim and traveling down and off the steep part of the mountain and perhaps as far as tree line. The first notable event occurred on Feb 1, 2021 at 10:54 GMT (02:54 am PST) and lasted about 10 minutes. The second and larger event started at 05:42 GMT on Feb 3, 2021 (Feb 2, 9:42 pm PST) and lasted almost 19 minutes. In both cases the strongest shaking is within the first few minutes of the event, probably when the largest mass of snow is moving the fastest on the upper slopes. Here is a seismogram for part of Feb 3 from station HSR located high on the south flank of the volcano. Each line is 20 minutes long and the color differences are only to aid the eye in separating lines. Several smaller events, a couple of which may be very small avalanches can also be seen on the record.
There are many seismic stations monitoring Mount St. Helens so it is interesting to look at the shaking at each of these stations all together. The following two figures show the seismograms for 7 stations for the two big avalanches. They are auto scaled to fit in their frame and instrument type and gain are different for different instruments so their relative amplitudes can not be compared on this figure. Note that the two figures have different time scales as well.
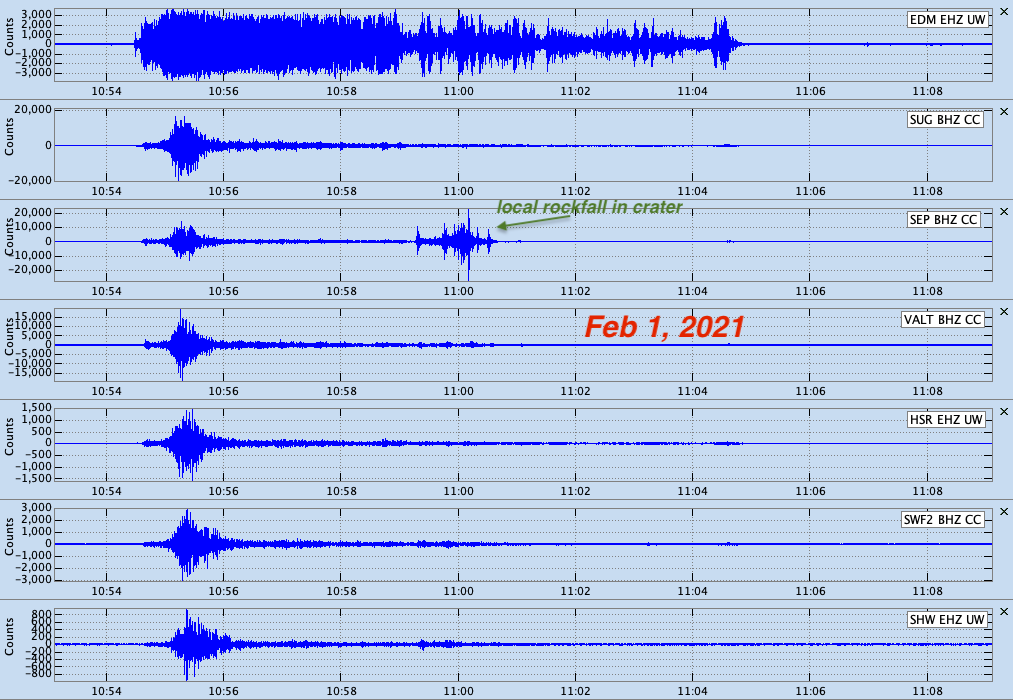
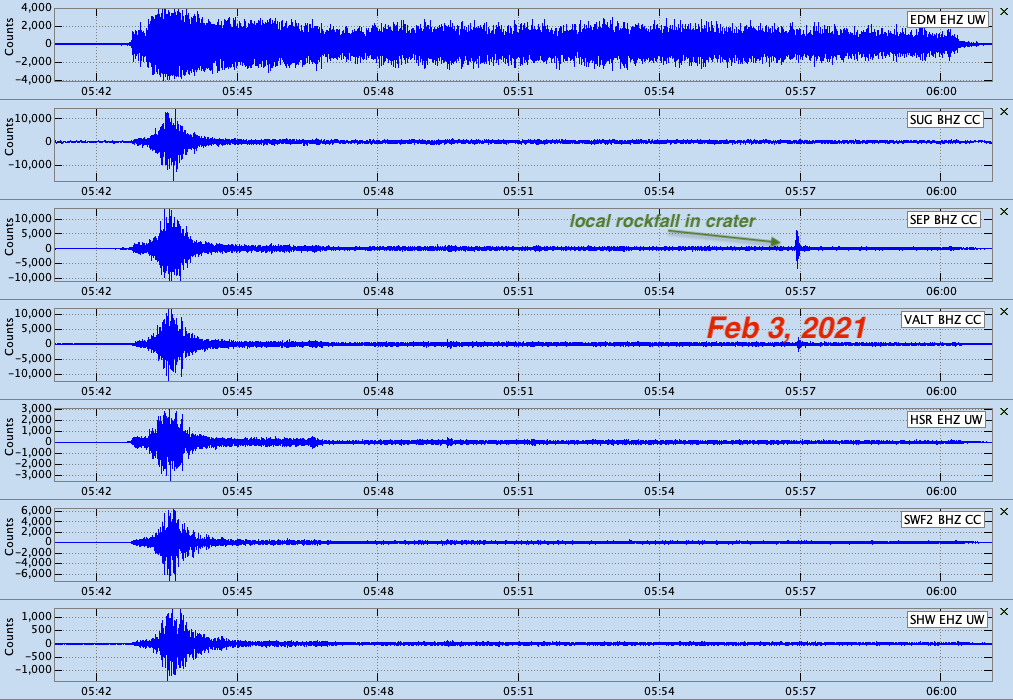
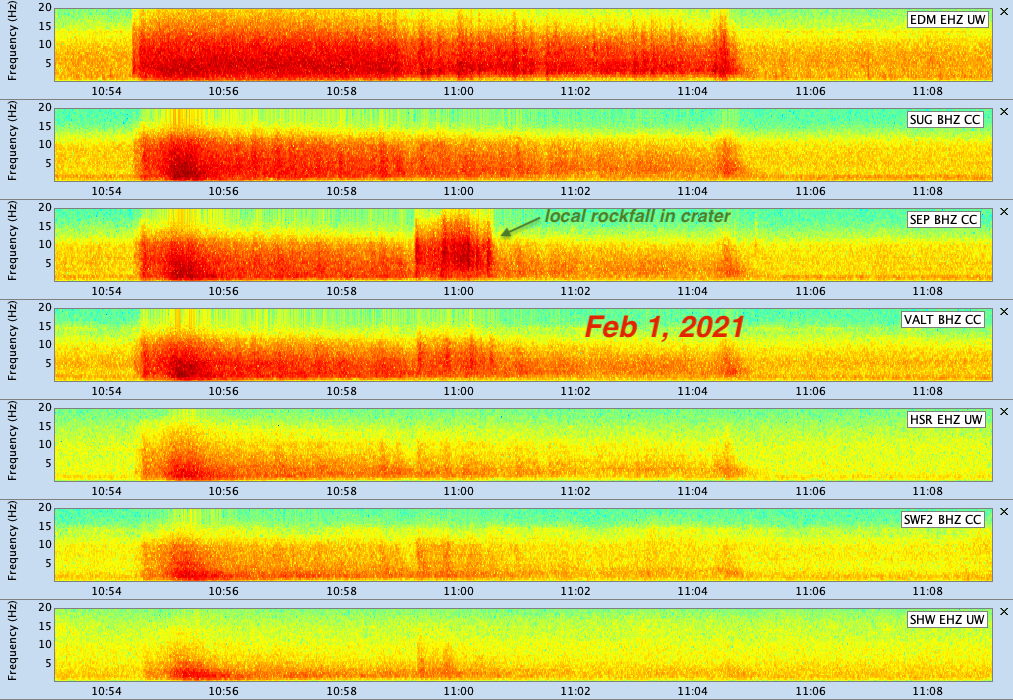
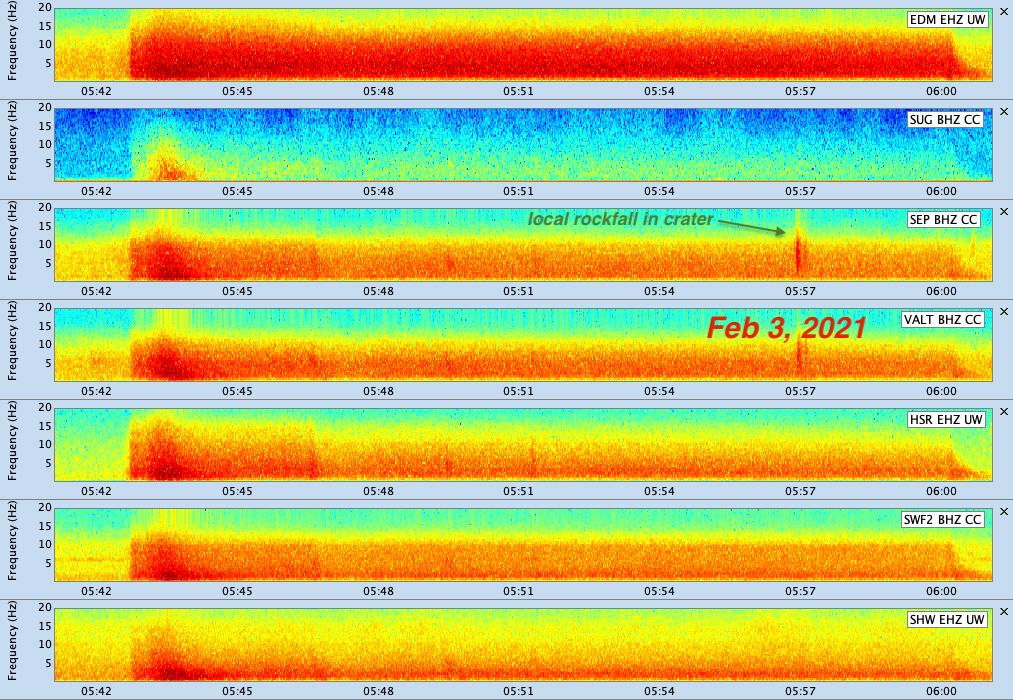
There are several things I find interesting about these seismograms. Each starts rather abruptly and then rapidly builds up to their maximum signal strengths within about 30 seconds. The high amplitude signals only last for 10 to 20 seconds and then quickly decay to a lower level that remains fairly constant for many minutes, perhaps slightly decreasing over time. However for both events the end of the signals are rather abrupt, perhaps preceded by slight increases in amplitude. These long duration signals imply a continuous source of shaking over this period, which means that either there were multiple back-to-back, merging together avalanches or once the major mass of material has fallen down the steep slope the avalanche changes to a comparatively slow moving flow that slowly moves across the lower, gentle slopes finally stopping with a jerk. One can look at these same data using what are called spectrograms ; as shown below. Here the time axis is the same as above but the vertical axis is frequency content going from 0 to 20 Hz and the colors are proportional to signal strength, red for strong and blue for weak signals. Some details I find interesting (but not sure I understand) are the observations that the early strong signals have much of their energy in the lower frequencies (2 - 4 Hz) while the long lasting later and weaker signals have energy throughout the band from 1 - 12 Hz). Again the " stopping" signal is quite obvious in these spectrograms.
Being an earthquake and volcano seismologist I am not sure how to interpret these sorts of avalanche signals other than in the most qualitative way. It is interesting to compare these figures with similar avalanches recorded in 2014 and written up in a blog at that time. Even more similar is an avalanche in March, 2011 that lasts 20 minutes and has the strange stopping phase, even stronger than in the current case. In 2014 there were two different avalanches, and like in the current case the second was larger than the first and lasted longer. There were also large avalanches on Mount Hood in 2010 and 2011 for which we have the seismic data and some photos. I will try to get these data written up and posted for comparison purposes soon. In the mean time I am hoping that the weather will clear enough that someone can fly over or snow-machine into this area to document what took place…. before it is covered up by new snowfall or more avalanches. If I get such ground truth I will update this blog at that time.