Mount Rainier earthquake swarm of July, 2025
Many people ask us “what is going on at Mount Rainier these days?” While we can say “an unusual number of earthquakes have occurred” the cause of them is not known for sure. A good conceptual model for “why” is that relatively minor changes in the hydrothermal (hot water) system at the core of the volcano have generated enough localized stress changes to break rock. Of course the breaking of rock causes shaking that we record as an earthquake. The U.S. Geological Survey’s Cascade Volcano Observatory (CVO) has a nice summary of this swarm and compares it to a previous one in 2009 from a volcanological point of view. In this blog we will deal only with the earthquakes and refrain from speculations about possible volcanic activity.
PNSN Earthquake Catalog
While there has been some seismic monitoring of the Mount Rainier area since the early 1970s it was not until about 1990 that stations were installed high on the cone allowing for detailed detection and location of earthquakes within the cone. The seismic network has grown over time until now there are 20 seismic stations on or near the volcano (3 at near 2.8 km elevation or 9,000’) that contribute to our monitoring data streams. When shaking is detected on more than four stations within a few seconds our computer systems are trained to declare an earthquake. Algorithms time the first arrivals (P-waves) and group them together for a standard location program to triangulate back to the source. It also estimates the event size or magnitude by the amplitude or duration of shaking. If the statistics on this automatic source location and magnitude estimate are good enough this earthquake is immediately reported to a public catalog on the PNSN web and the Comprehensive catalog (ComCat) which is hosted by the USGS. These events, as well as ones detected but not well automatically located are reviewed by an experienced human analyst. This review process inevitably results in a better estimate of each event’s location and size but takes time to produce. With earthquakes occurring many times per hour for days the manual analysis cannot keep up. A triage process is used to first analyze the larger or different looking events and then fill in smaller events when time allows. The result is that our catalogs change over time. Not only the most recent events but older events may change or be added as the manual analysis catches up. As of 10 days into the swarm about 1200 total events were recorded by the computer systems but only 780 have been manually analyzed leaving 420 still to do. Be patient. We are working over-time to catch up.
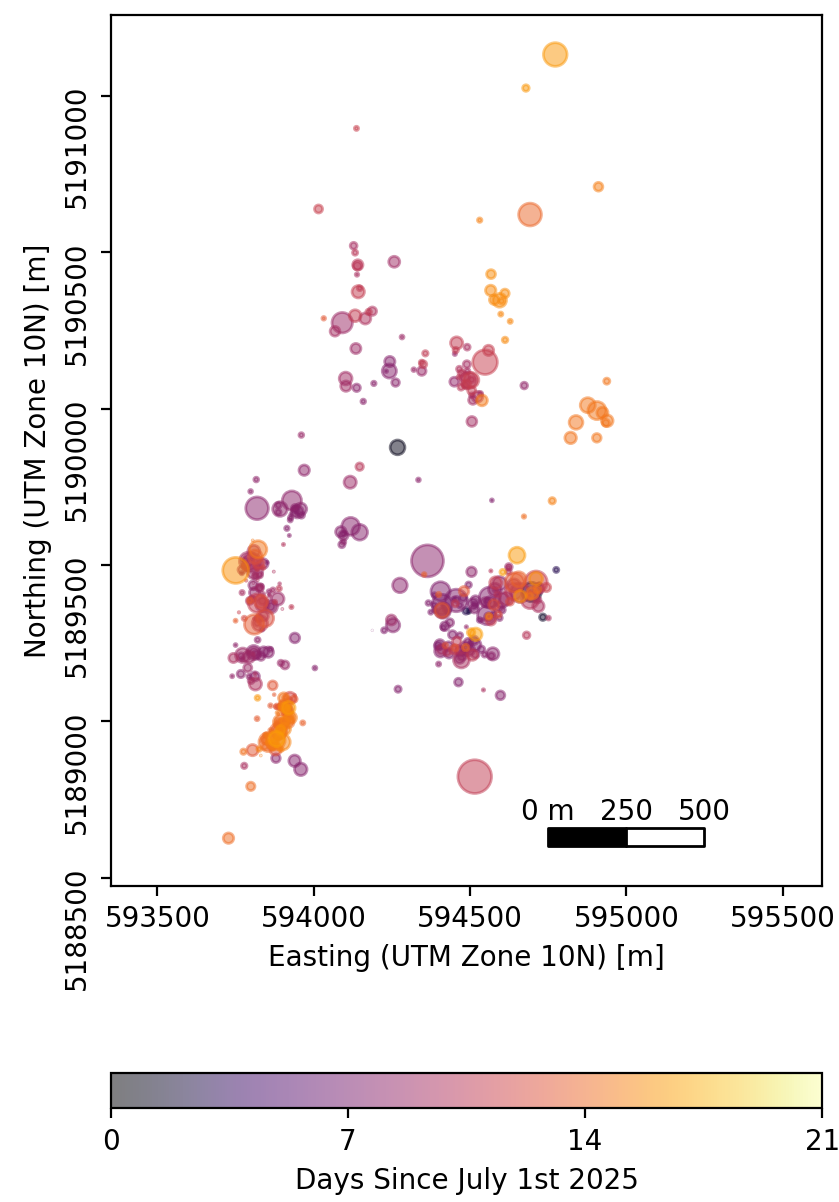
In the meantime here are some snap-shot summary plots of the locations of earthquakes made from our public catalog. One can use the analysis tools of our web system (use the “analyze” panel on the right of our map views) to update or make similar plots for this or other event selections as you wish.
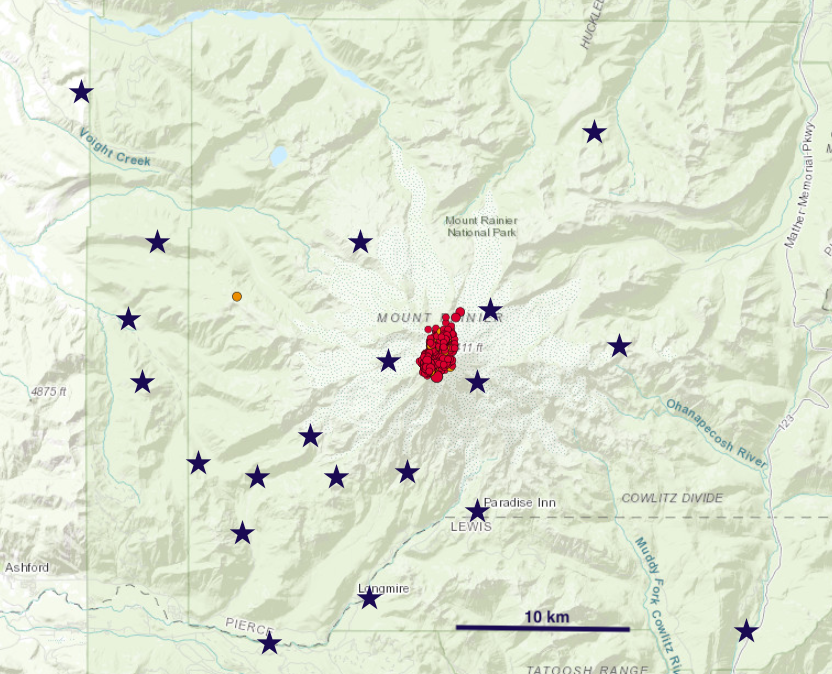
East-West cross-section of Rainier swarm earthquakes. Note that 0 km depth is sea level.
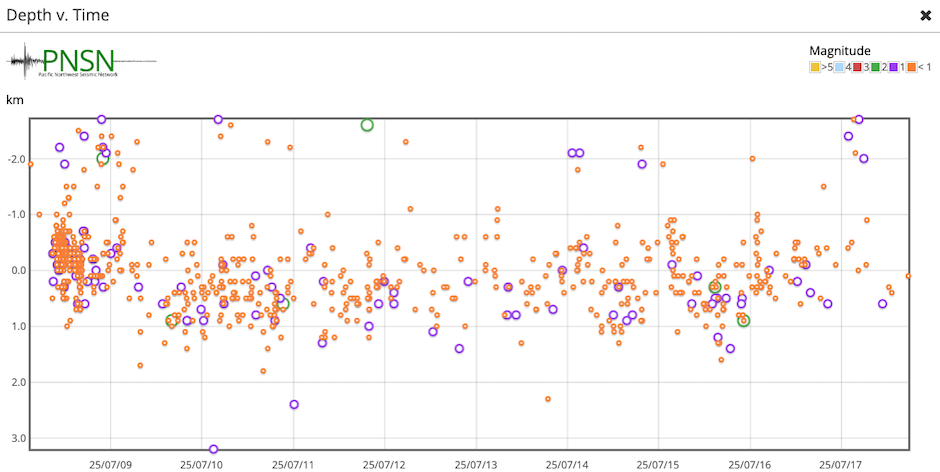
Time-depth plot of Rainier swarm earthquake starting on July 8, 2025.
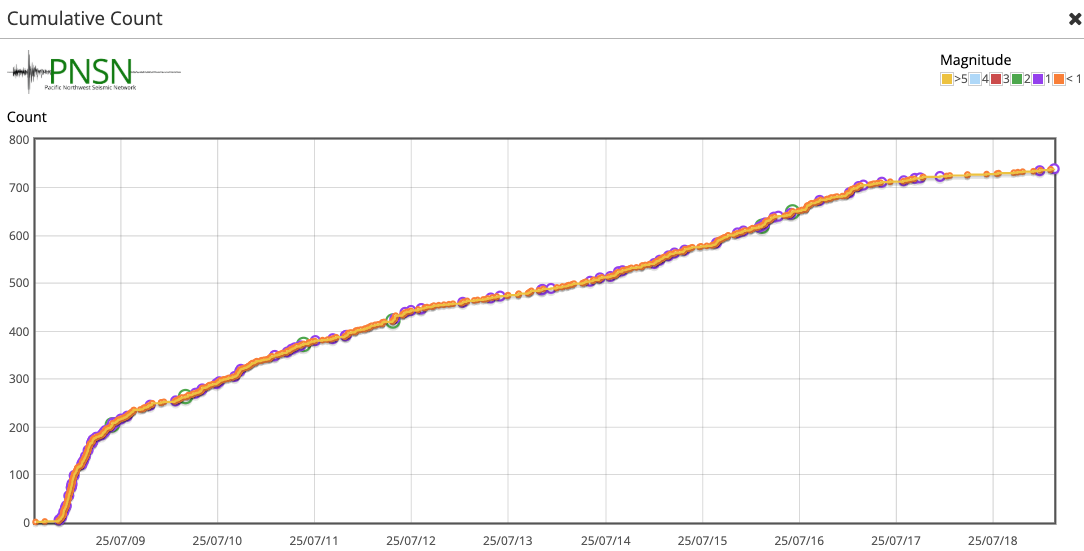
A plot of the cumulative number of earthquakes located in the Rainier swarm starting on July 8, 2025
Ongoing Scientific Projects -
Besides trying to keep up with the routine analysis of the detected earthquakes our science staff have been developing and implementing more advanced detection, timing and location procedures to allow us to look at the activity in more detail and perhaps more precisely than routine analysis allows.
REDPy -
A detection system that was developed by a previous graduate student has been running with configurations set up for several northwest volcanoes including Mount Rainier. This Repeating Earthquake Detector written in Python (REDPy) takes waveforms from a subset of PNSN stations, looks for deviations in signals, selects several seconds of waveforms at this point and then after filtering compares waveforms with all previously detected events. When it finds waveforms that match it groups the events into families that represent repeating or very similar earthquakes. When earthquakes break the same or very nearly the same rock the seismic waves generated should be nearly identical. Thus finding families of repeating earthquakes is indicative of the same or very similar chunk of rock breaking. What this means in terms of volcanic activity is of interest but not well understood. Thus far REDPy has found 48 different families, several with only two matching earthquakes, many more families with 10s of matches and 5 families with over 100 matches each. Some families have lots of matches early in the sequence, some mostly later in the sequence and a few have events throughout the sequence. There were over 2,000 total matches meaning that at least twice as many events have waveform matches than we have been able to individually locate.
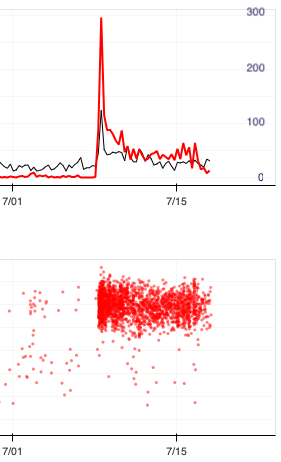
Section of a REDPy time plot showing: Top: the number of matches found (red) and non-matched detections (black) in a 6 hour window; Bottom: Relative quality of the match.
Template Matching -
Complementary to REDPy, we are applying another similarity-based detection method called Template Matching to seek out the smallest detectable earthquakes emanating from Mount Rainier. Whereas REDPy starts matching events after they are detected by just amplitude increases, template matching uses pre-specified examples (templates) taken from the waveforms of well located events and slides them across large swathes of seismic recordings, detecting matching pieces of the seismic record when the shapes of the waveforms on many channels align with one (or more) templates. If those templates are reasonably similar to earthquakes not previously detected, we have a very effective tool to find them.
We ran our first template matching analysis using 25 analyst reviewed and located earthquakes as templates on the afternoon of July 8th, detecting roughly 2200 candidate events over the 12 hours from the start of the swarm early that morning. Subsequent visual review confirmed roughly 95% of these detections were valid, though many were tiny earthquakes. We have continued to review, refine, and refresh our template matching analyses, incorporating more events and new data as they become available. The most recent analysis on July 17th used 423 analyst-reviewed earthquakes as templates and detected roughly 8,800 distinct events.
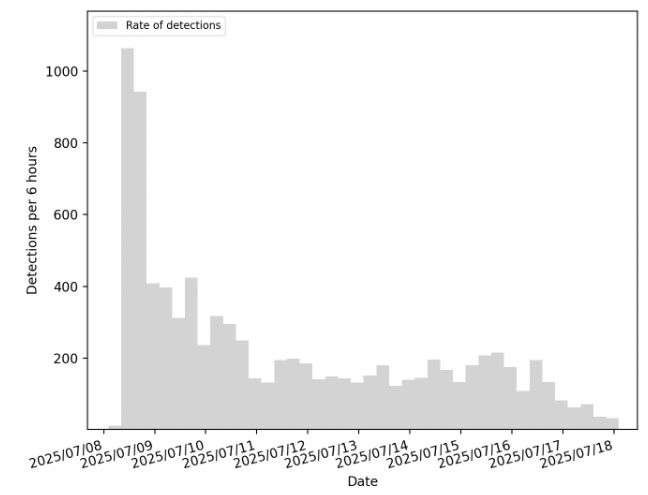
Plot of detection rates between July 8th and July 18th 2025. Detections are counted in 6-hour blocks and dates are in UTC time (subtract 7 hours to get local time).
High resolution earthquake locations
Our routine processing locates earthquakes one at a time using a simple one-dimensional seismic velocity model to calculate the travel times from source to seismic stations and a very traditional location program to invert for the latitude, longitude, depth and origin time of each earthquake. More modern location routines are available that can take advantage of having many different earthquakes in the same area to help account for a more complex seismic velocity structure (such as certainly exists in a volcano) and tiny errors in determining the arrival times of seismic waves. Some of these techniques are being tried with the Rainier swarm data but results are still too preliminary to cover in much detail here. A preliminary look at the results of one of these techniques (see below) confirms the general location for the events but shows that while the whole sequence is spread out over ~2.5 km in a NNE-SSW direction it consists of a number of more tightly clustered events into blobs, some only a few 100 meters across.
PNSN Web system redesign -
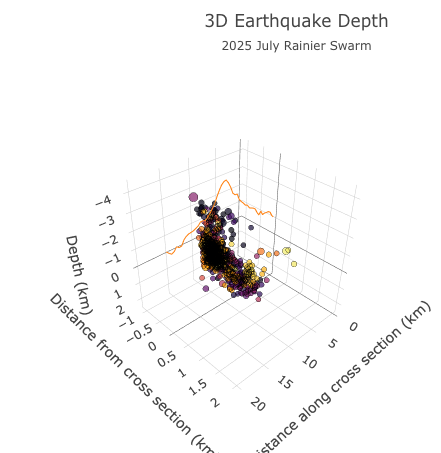
For the past year the IT and out-reach staff of the PNSN have been hard at work doing a major redesign of our web pages. While this process is ongoing and it may still be a few months before it is ready for public release there are some very nice new features that will be included. Besides an update of the basic content there are graphical display options that will let the general user view the results of our seismic monitoring in new, interesting and appealing ways. For example below is a static image of the current Rainier locations in a 3-D type view that when live will allow the user to rotate it to any desired orientation. There will also be ways to place indications of fault motion (focal mechanisms) on maps and cross-sections for groups of earthquakes.
Stay tuned for more interesting research results and fun web page updates. Again, for volcanic hazards and updates refer to the USGS CVO update web pages.
Contributions from: Renate Hartog, Nate Stevens and Kyla Marczewski.