The Evolution of "Seismograms"
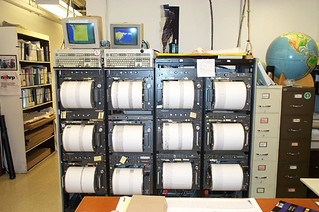
helicorders
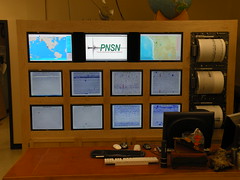
PNSNWallofSwarm
When I arrived at the PNSN as the new, part-time, Seismology Lab Coordinator in 1993, my desk sat in front of racks of helicorder drums recording ground motions from a dozen stations around the region. When significant earth quakes occurred I received the earliest alert as the pen from the helicorder station nearest the earthquake flew back and forth rattling on the paper coated metal drum. This sound would soon be joined by others as the seismic waves moved across the region and folks would rush into the Lab to guess at where the event occurred and how large it might be before the computer data was available for analysis. In the late 1990s we began to make electronic versions of the seismograms the helicorder scratched out available for all to examine on our web site. Some worried that the public were not trained to interpret these records and might panic when a windy day resulted in noisy records or try to predict volcanic eruptions when a swarm of earthquakes occurred under a volcano. These concerns were set aside in favor of expansion of our "all earthquake information is public" policy and this has worked well for the public and the scientific community. In 2007 we replaced most of the helicorders with computer displays that build seismograms directly from data in our "seismic wave tanks" on our computer servers.
In mid September the PNSN rolled out its new "Seismograms" web area that provides new tools to allow everyone to view, and now manipulate our data. The old style webicorder pages are no longer being created. This has been upsetting to some who have gotten use to the old format but it our hope that with a little practice the new pages will prove to be more useful for all.
What has changed? We are producing many more seismograms. The old system of of generating webicorders was limited to 100 channels of data in 20 channel batches and these processes were built into our old "Earthworm" data processing software. If we wanted to add a channel we had to kill another to make room. This year we upgraded to the new USGS supported "AQMS" or Advanced National Seismic System (ANSS) Quake Monitoring System. Our new method of building seismograms works separately from the AQMS routines and is no longer limited to 100 channels. Our new seismogram page now offers images for every data channel we maintain as well as some supported by our partners in adjoining regions producing over 850 seismograph images for your perusal.
Access to older data. The old seismograms dropped off the web after 4 days limiting what "time" you could view. The new system will retain seismograms for about 6 months starting August 1st of this year. Already we have accumulated over two months of data you can access with our seismograms.
Improved user interface or "UI". Many people loved the old style webicorders that have been produced since the mid 1990s. That is a lot of time to get used to the display and web page layout. We hope users will soon get comfortable with our new page design and navigation tools.
When clicking on "Seismograms" from the home page menu, you will go to a PNSN region map with blue and yellow numbered station clusters on it. These are links to zoom into the region you are interested exploring. The numbers is the minimum number of stations you will have access to in this view (some area views overlap others and more stations are available).
Click on a station icon to view station information and link to the latest seismogram from that site. You can display stations by type, network, or zoom to a region by using the Filter feature (see above).
Click on "view seismogram" to view the latest seismogram from that station. From this level more new options become available. The header will show the station name, general location, type of instrument, and channel you are looking at. If the station has multiple channels you can look at any of those from the channel drop down menu. Click on the "stations near" box to get a list of nearby stations. This is helpful to see if a signal picked up on one station is visible at another nearby. If not, the signal is likely to be a local surface event or electronic glitch and not an earthquake. In the upper right hand corner of the seismogram view page you can always ask for a "list" which will bring you to the list of all available stations organized by instrument type. Click map and you shortcut back to the beginning map with station clusters. Another great new feature is the ability to move through time easily. At the top of the seismogram are "<< Previous" and "Next >>" buttons that that allow you to move back and forth through time one day's seismogram at a time. Unfortunately, if you are viewing todays seismogram you will not be able to advance to tomorrow. Jump to any available seismogram by choosing a date in the calendar drop down menu. If the date is lit in blue the seismogram image is available for that day.