Is Mount St. Helens seismicity increasing?
The Mount St. Helens area has received a lot of attention recently. The apparent big increase in located events seen on the "Quakes near volcanoes" plot has generated some interest and questions from the public. So, is this activity unusual? Does it mean the volcano is preparing to erupt? There is, of course the iMUSH experiment taking place there now that includes some explosions that the PNSN locates. But these are only half a dozen of the 87 events located near the mountain in the past month.

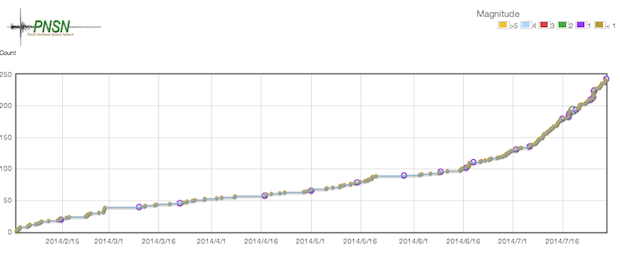
Another way of looking at the changing seismicity rate is a cumulative seismicity plot in which the number of events occurring before a certain date are plotted against that date. Above is a last 6-month cumulative seismicity plot for the area around Mount St. Helens (shown in the map below). The obvious increase in slope starting in mid-june and again in early July represents increases in event rate. This is exactly the kind of plot that alerts a volcano seismologist to volcanic unrest that could lead to an eruption.
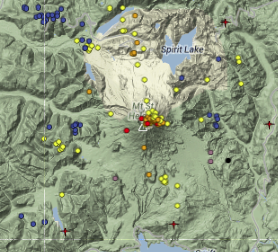
BUT, BE CAREFUL! Interpreting such plots without understanding the nature of the data used can be highly misleading. Note that the data used is for a region around the Mountain from north of Spirit Lake to south of the Swift River reservoirs and many of the events showing up are not from the volcano at all.
 Here is a seismicity map of the Mount St. Helens region for the past three months. The symbol colors are proportional to the event depth; red les than 1 km deep progressing to blue for events deeper than 10 km. The star symbols are for known and probable explosions (quarry blasts and iMUSH shots). While many of the events, particularly small ones, are located right under the volcano there are also many events at quite a distance away. Such distant events are rarely related to pre-eruption unrest.
However, much more important to the interpretation of the apparent seismicity increase is the way the event catalog was produced. With the installation of iMUSH passive experiment seismic stations starting in mid-june much greater care has been taken to detect and locate every possible seismic event in the region. Typically the PNSN uses an automatic seismic event detector that recognizes when seismic signals on several stations becomes significantly larger than the normal background signals and interprets this as an earthquake of possible interest. This technique works very well for most earthquakes, certainly those large enough to be felt or of much significance. However, very small events whose signals are not much different than background levels are missed. During the iMUSH project PNSN staff are spending extra time examining the seismic records by hand and using special versions of the records such as spectrograms to detect the absolute smallest events. Also, Dr. John Vidale, the PNSN director, has adapted some research software to run specifically on Mount St. Helens data to help detect the very smallest of small events.

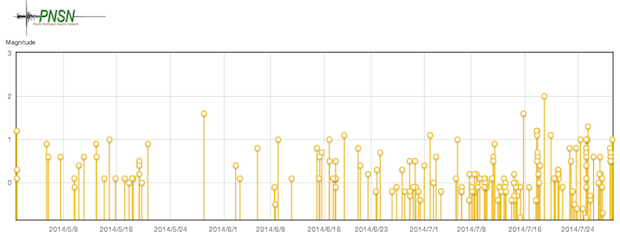
To illustrate this change in detection threshold above is a plot of individual event magnitude versus time. Note that in May and early June few events were around magnitude 0 (zero) or less. (NOTE: keep in mind that magnitude is an open-ended logarithmic scale in which earthquakes of magnitude 0 are ten times smaller than magnitude 1 and magnitude -1 is yet 10 times smaller than a magnitude 0). After mid-June most of the events are less than magnitude 0. That is, the detection of the very smallest events since mid-June gives the impression that many more events are occurring when in fact it is just an artifact of the extra care being taken to detect very small events.
Thus, while for a volcano seismologist it would be quite interesting and even exciting to observe a real increase in seismicity related to the volcano, it looks as if that is not the case. We see no evidence of volcanic unrest what so ever, just the results of curious scientists looking closer at normal, background activity.