Another Seahawks game experiment - Jan 7
PNSN Monitors the Seahawks-Lions game, Jan 7, 2017
We have some new instruments and new students/staff and what better way to test both than to test the enthusiasm of Seahawk football fans by recording the shaking generated during a play-off game. In cooperation with the Seattle Seahawks organization we are putting seismographs in Century Link stadium for the Jan 7, 2017 play-off game against Detroit. As we have done in the past. we are providing live waveform data via our new and improved web-based QuickShake display system and will be providing summary seismograms (with annotations) via the Hawk-O-Grams and a new RSAM plot showing averaged signal levels over time. This blog will be updated from time to time with more information and analysis during and after the game.
As an additional part of our out-reach efforts to help educate people about seismology we are providing a downloadable hand-out with details of some fun ways to have seismology help watching the game on TV. Since TV broadcasts are slightly delayed from realtime and our QuickShake waveforms have almost no delay one can "see" the crowd's reaction to a play on the waveforms before you actually see it on TV. Download and print the handout and try it. It might be particularly good for elementary school kids to do citizen-science, and help their parents anticipate successful Seahawk plays before they actually see them on TV. Download the printable PDF worksheet from: 2017_Seahawks_worksheet.pdf. Our version of the answers will be posted on this blog after the game.
Attention Seismologists: Waveform data for this experiment is available from the IRIS DMC.
Web based seismic displays:
QuickShake - Realtime, crawling display of seismograph channels from stations in and near CenturyLink Field. Note controls at the bottom pop up for scaling the traces with a slider, stopping and starting and scrolling backward in time (up to previous 10 minutes). Configure pop-up in upper right corner allows for changing from vertical channels (Z) to either East-West channels (E) or North-South channels (N) or also to a set of "noise comparison" channels including the very active (HWK6), the quiet (HWK1), a medium level (HWK3), the station outside the stadium (KDK) and a very quiet remote station near the coast (COOS) . Previous saved interesting events can be recovered and displayed from the Events pull-down. The order of displayed traces can be changed by clicking and moving a trace up or down and the duration of a trace in the viewer window can be selected in the Viewer Width pull-down.
Hawk-o-Grams - Standard six-hour-long seismogram plots such as provided for all PNSN stations but these are for the Special CenturyLink Field stations and will have annotations put on them after our seismo-football-fans witness action on the field.
RSAM - Experimental Realtime Seismic Amplitude Monitor that shows plots of 10 second averages of the signals from the 6 HWK stations. This is the type of display that volcano seismologists use to get summary information from seismic data at volcanoes during eruptive periods or volcanic unrest.
Fan-o-Meter - Static fixed display of the same stations as QuickShake with no controls or configuration allowed. Updates only every 10 seconds. (Provided as a backup for QuickShake).
Some background information from pervious experiments:
Main PNSN Seahawk webpage. Original Beast-Quake article in the scientific publication "Seismological Research Letters", 2011 Descriptions and analysis of 2013 playoffs. Descriptions and analysis of 2014 playoffs The final analysis of the 2015 Packers playoff game and subsequent Seismological Research Letters Earthquake-Lites, 2015
Updates:
Jan 5, 2017 - Installation of the 6 temporary stations took place during the afternoon today by a volunteer group of staff and students. HWK1, HWK2, HWK3 are located in the same places as for previous experiements. The three other HWK stations are at new locations to help illustrate the variety of shaking that takes place in different places.
Jan 6, 2017 5pm PST - We now have most systems running and analysis and display software in place. There are still a few bugs to iron out to make sure things all controls and descriptions work and are reasonably clear. BUT, this again is an experiment. Most experiments have problems or unexpected results. Our social media feeds on Twitter and Facebook will try to explain things as we go. What could go wwwwrrrrooonnnnngggg. ooooooops.
Jan 7, 2017 11am PST - Several different technical problems were solved this morning and a final version for the new RSAM display was made. The time period for the RSAM to cover will be adjusted this afternoon to pretty much only cover the duration of the game.
Jan 7,2017 8:30pm PST - The Seahawks won and our seismic experiment worked pretty much as we had hoped in every case. We have had a few glitches with the QuickShake sometimes not responding when first started or changed but after a few adjustments this happened very rarely and would almost always get going after trying it again. We are still understanding how to interpret different types of plots but, as during previous games, we could easily tell from the changes in the seismic signals on QuickShake how successful a play was going to be before it even started. There has been lots of responses on our social media feeds.
Here are our versions of the answers to our worksheet. Of course some of this is just interpretation at this point and we could be convinced of slightly different answers.
Based on a significant signal you observe, estimate what is the delay in seconds between QuickShake and your TV broadcast? __~12 seconds_____________
Based on the seismic signals visible on QuickShake, are you able to predict whether or not a big play is about to be broadcast on TV? _Yes, in most cases, however there were a few times when crowed reaction seemed less than expected._________
What play caused the largest recorded seismic signal? _Wilson TD pass to Baldwin near end of game__
What time did that occur? ____just after 8pm________________________
How long did it last? ____At least 30 seconds but some shaking going on even longer_
What seismic station recorded the largest motion throughout the game? _HWK6______
More analysis will be added here within a few days.... need some rest first.
Jan 9, 2017 5pm - Reports from our web guru and social media folks indicate that the interest in seismo-fan shaking is less than in the past. It is becoming too routine. Below is a time plot of the traffic on our (pnsn.org) web site during the game.
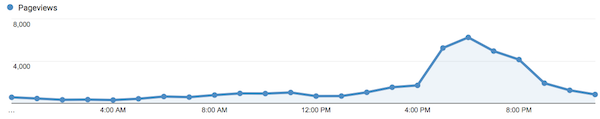
Total page views during this period of time was about 38,000 (only about 1/5 as many as for the final playoff game in 2014. The QuickShake page was the most popular. Our social media posting did much better with 244,000 "impressions" during the week, about half as many as for the final game in 2014.
There were a number of interesting recordings observed, the analysis of which will take a bit more time. So, check back in a few days to see if any "interesting" discoveries have been made.
Jan 10, 2017 10am - The RSAM plot (new for this game) provides a nice summary of the shaking level recorded at all stations for the whole game. Below is an annotated version of the RSAM plot for the four hours (01 - 05 GMT or 5pm - 9pm PDT) including the game.
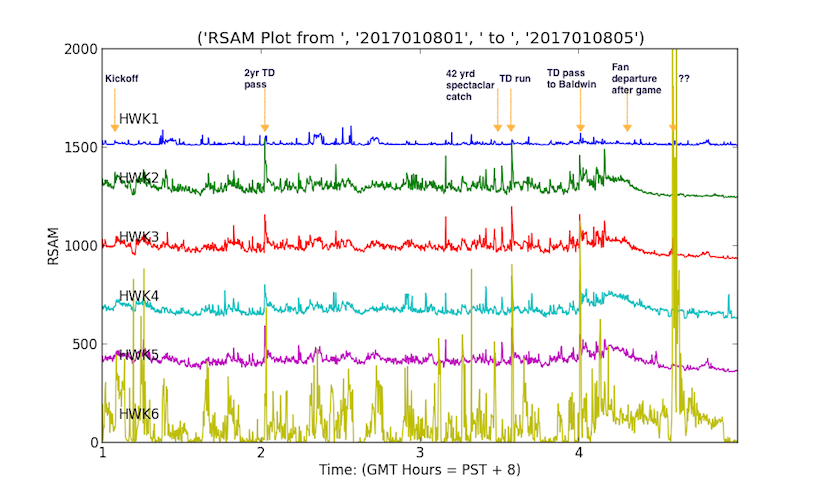
There are many bursts of shaking shown on the plot, some of which it was hard to determine what caused it. In particular HWK6 has VERY high levels of shaking (the amplitude of the trace plotted here has been divided by a factor of 5 just to get it to a level that could be shown with the rest of the traces). It has a response similar but much larger to that of the other stations for some of the big plays, but also has changes in shaking level not correlated with changes on other stations. HWK6, high in the "Hawk's Nest" is probably reacting to local fan motion that may not only be in response to big plays on the field. The really large burst of activity long after the game was over is a total mystery. Some of the other bursts of activity on this plot we understand better. Those bursts showing up on all channels are obviously general fan response to successful plays on the field (several are annotated on the plot). The longer lasting squared off parts of the HWK1 trace we think are due to the passage of a large freight train on the tracks just to the east of the stadium. This station is at ground level and thus responds less to fan motion but can see the shaking due to the nearby train. Note the gradual decay of shaking amplitudes after the game as fans are departing. The decay seems to last longer on HWK4 and HWK5 than on HWK2 and HWK3 probably due to many fans in the south end of the stadium exiting through the north part and thus near those stations longer.