Typical Mount Hood Earthquake Swarm
As of the afternoon of July 9 the current Mount Hood earthquake swarm seems to be dying down as have previous ones in the area . Because the public can easily see our basic data (seismograms and epicenters) there is frequently lots of excitment on social media. While most people follow with interest and may have interesting comments there are always a few who jump to conculsions not supported by the current data or previous research. Basically, unlike what a few comments say, we feel this swarm is highly unlikely to be due to impending volcanic activity. It has all the characteristics of previous "tectonic" swarms. Earthquakes are occurring on regional fault structures that happen to be near the volcano but have the characteristics of responding to regional stresses that are not associated with magma movement or changes in local magmatic pressure.
Please see some of the following for information about similar swarms:
Explanation of Mount Hood seismicity
and for interpreting the latter see: Volcano seismicity tutorial
For a technical, in-depth study of similar swarms see: BSSA paper by Jones and Malone
Also, see the Cascade Volcano Observatory page on Mount Hood swarm
Now for some details on this swarm.
As of the end of the July 9, 2019 GMT we have located 83 earthquakes in this swarm starting on July 7 at 02:00 GMT (July 6 at 7pm PDT). There have been several events of about magnitude 2, but nothing larger. Because there are several more sensitive seismic stations currently operating near Mount Hood than there were for swarms many years ago the total number of events located is not a good indicator of the strength of the swarm. More smaller events can now be located than were usually located in the past. The following map shows the epicenters for this swarm so far:
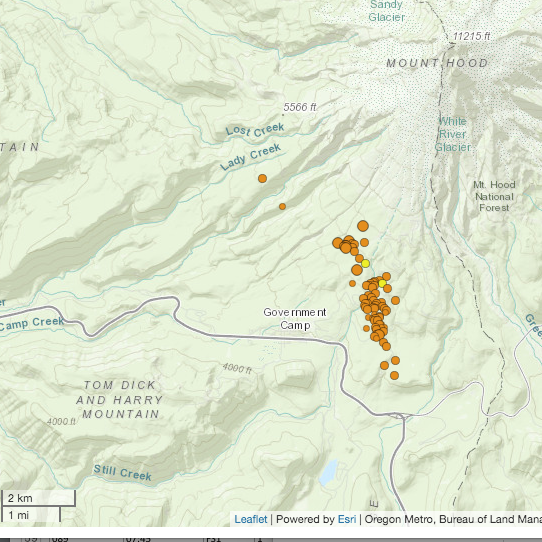
Note that the events line up more or less in a straight line, angled slightly to the north-northwest. This is similar to previous swarms in this area and is consistent with a fault or weak zone elongated in this direction. In the following I show a time versus depth plot:
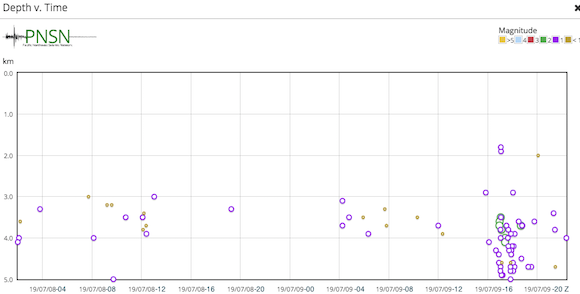
Most events fall into the depth reange of 3 to 5 km below sea level (4 -6 km below the average surface in this area). The spread in depth during the hours of 16: to 18:Z on July 9 is possibly an artifact of different stations being involved for different events due to the interference between waves coming from events closely spaced in time. Depth errors of 1 or more kilometers are likely for these events. The clustering of many of these events within a few kilometers of each other is consistent with our RedPY system for finding clusters of earthquakes with similar waveforms. Over half of these events show up as belonging to the same RedPy "family" of events, though only about half of those have high coherency, meaning tightly clustered.
In the following two plots I show cross sections of the hypocenters first along the obvious line-up (strike) of the events and then across it.
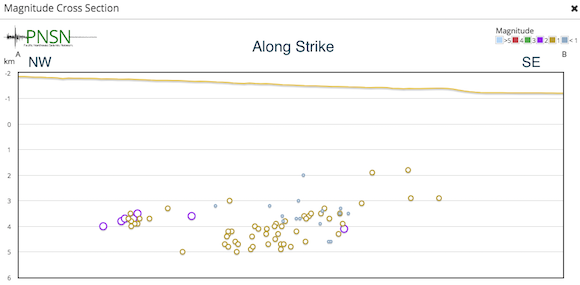
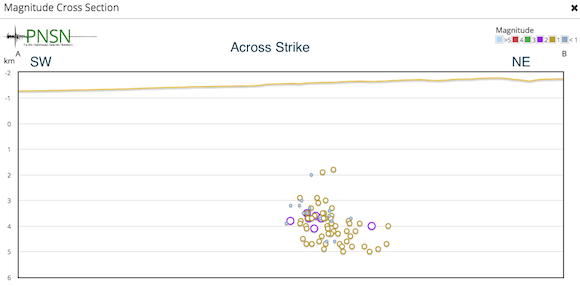
These plots show just another way of looking at the distribution of hypocenters. Note that most of the larger events are located toward the northwest end of the distribution.
It may be of some interest that recent geologic mapping has identified several faults in this area that are possibly causitative for these earthquakes. Figure 1 of the "Mount Hood Fault Zone" section (by I. Madin et. al. 2017) included in the USGS Scientific Investigations Report 2017–5022–G, Field-Trip Guide to Mount Hood shows two fault zones in the area of these earthquakes. They are oriented more north-northeast than the alignment of epicenters in this and previous swarms, but there could be similar strutures at depth with a slightly different alignment.
Unfortunately, any focal mechanisms generated for these events are very tentative because of the few good first motions and distribution of stations. The number and distribution of obvious first motions are consistent with these events being due to normal faulting. That is most first arrivals are compressive other than those from stations right above the hypocenters. Thus the major compressive axis is near vertical and tension axis is horizontal. The orientation of any of the fault planes is not at all well constrained by the focal mechanisms. Tensional faults are common in this area and regionally to the south and east.
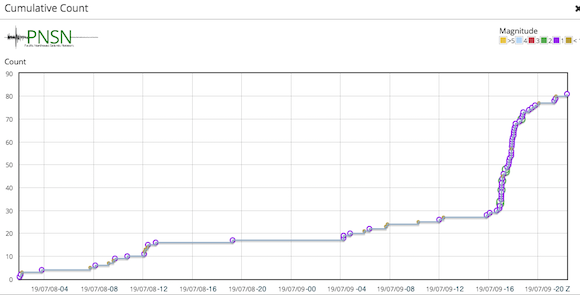
With all this in mind, our interpretation remains that this is a normal swarm consistent with those studied in the past. What will happen next? The following plot shows the cumulative count of located earthquakes up to the end of July 9 Z (5 pm PDT). After the sudden burst of activity earlier today it seems the activity is dying down. We would not be surprised by additional small bursts of activity and a larger burst is possible though not likely.