Mount Hood


Mount Hood is a potentially active volcano, and the highest peak in Oregon State. It is located approximately 75 km ESE of Portland, OR.
In the last 1,500 years, Mount Hood has had two major eruptive periods that produced lava domes, pyroclastic flows and mud flows, and minor ash fallout. The most recent major eruptive period began in 1780 and lasted for one to two decades. Minor eruptive activity was observed during the mid-19th century. Rapid melting of snow and glacier ice by pyroclastic flows can generate large lahars that race down river valleys.
More information about Mount Hood
Background Seismicity
The Cascades Volcano Observatory and the PNSN cooperatively operate 6 seismometers on or near Mount Hood. On average, we locate 0 to 3 earthquakes within 10 km of the volcano each week.
Mount Hood Seismicity
Short-cut to spectrograms for Mount Hood
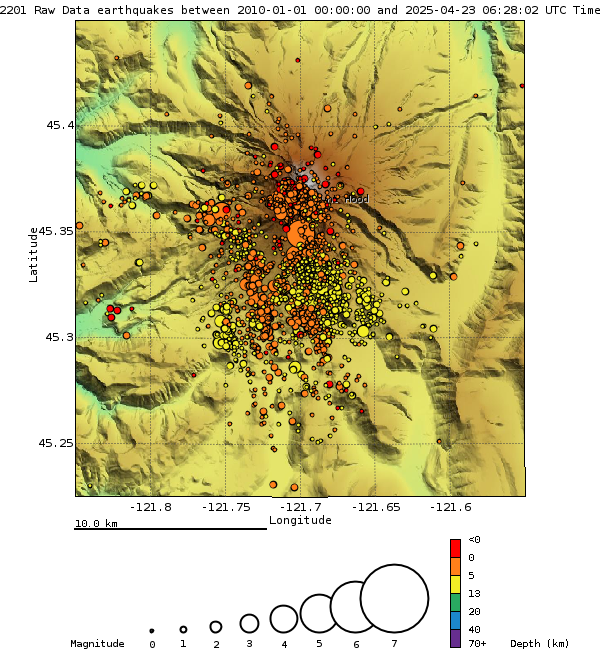
Seismicity at Mount Hood is primarily characterized by fairly intense swarms of micro-earthquakes which typically occur about 4 to 7 km south of the summit. Over three quarters of the earthquakes that were located at Mount Hood during the 1990s occurred in these types of swarms. These swarms usually last from a few hours to a couple of days and have had as many as 50 well located earthquakes and as few as 4. The largest event in a swarm usually does not occur at the beginning (such as a main shock-after shock sequence). The largest event in the roughly 15 sequences during the 1990s varied from M=1.6 to M=3.5. NOTE: In Feb. 2012 a very small earthquake swarm took place resulting in a blog posting on the PNSN web pages. More extensive explainations of Mount Hood swarms is contained in a blog posting about a swarm in 2019 and more recently and slightly to the east a swarm in January 2021.
Recent Seismicity (2010 - )
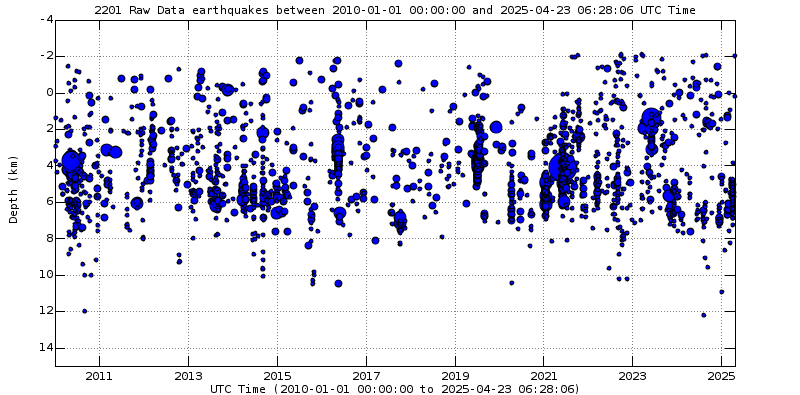
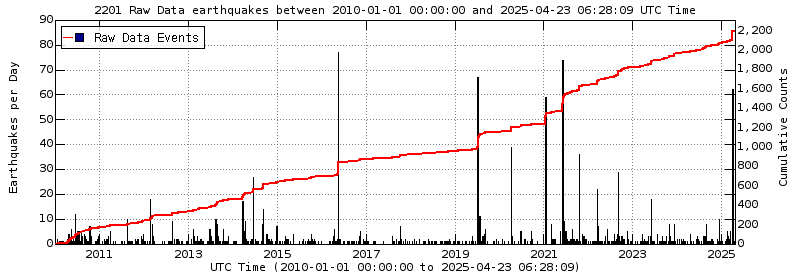
Below is a time-depth plot of earthquakes located directly under Mount Hood since 2010. This plot is updated weekly until 2020 when a new plot will start... unless, of course unusual activity takes place that suggests a different time sequence is needed to better interpret that activity. Keep in mind that the PNSN earthquake recording and processing system changed in very major ways starting in 2012 and thus there can be small biases or changes introduced in event detection, location and size. We think these changes are very small but one should still be aware of this possibility.
NOTE: A depth of 0.0 (zero) km is at sea level and thus events within the volcano will plot above sea level (negative depths). See the blog for more details.
Previous Seismicity (1980 - 2010)
Below you will find an epicenter map, time-depth plot and seismicity plot for a region around Mount Hood for the three decades, 1980 - 2010 that shows typical or background levels of earthquakes in this region. There are a good number of seismograph stations located on (2) or very near (5) the volcano such that the regional seismic network can reliably detect and locate earthquakes of magnitude 0.5 and larger in this area. Even smaller earthquakes can sometimes be detected and located though some also are missed.
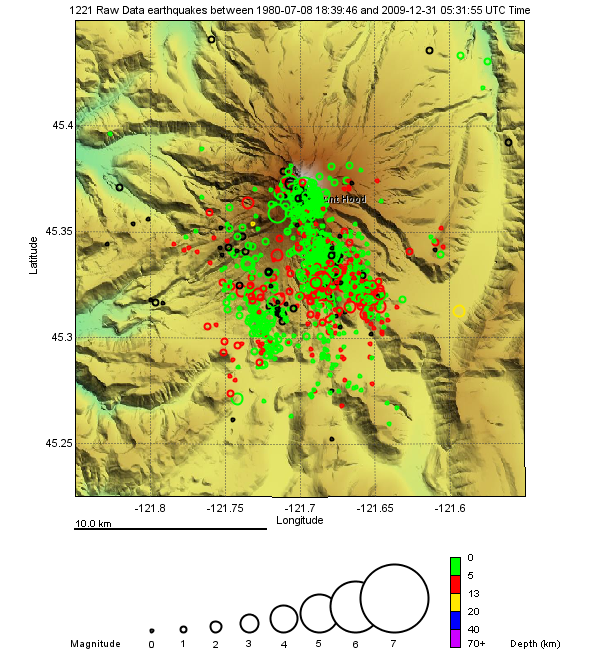
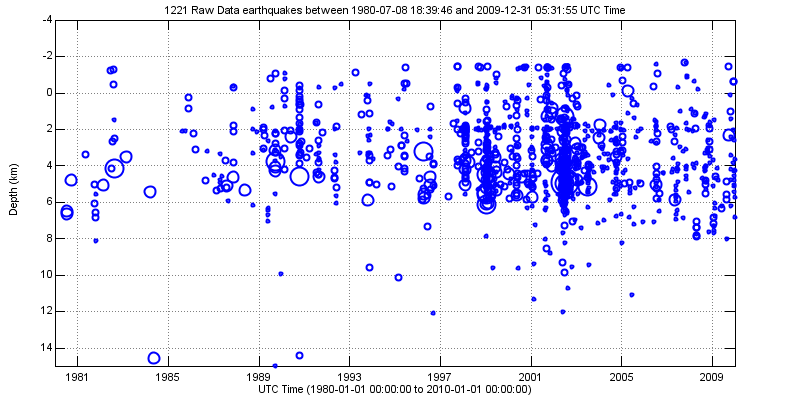
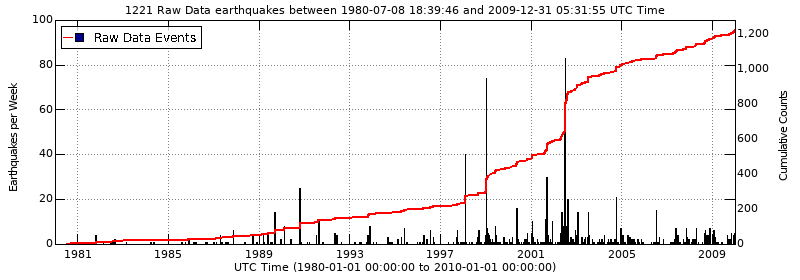
All of the earthquakes in the Mount Hood sequences have characteristic waveforms similar to tectonic earthquakes. Swarms of these types of events are fairly common on many volcanoes. These are in contrast to low-frequency volcanic earthquakes which have a very different character and may be indicators of a possible eruption. While some earthquake occur directly under the edifice most of the Mount Hood events likely are occurring on a fault or fault system located to the south of the volcano and represent either its reaction to regional tectonic stresses or possibly deep-seated volcanic stress below the region. Volcanic history and details of Mount Hood is summarized by pages at the Cascade Volcano Observatory.
Some earthquake swarm at Mount Hood, in particular January, 1999:
An earthquake swarm began near Mount Hood in northern Oregon early Monday morning (Jan 11, 1999) and produced more than two dozen earthquakes that day, the largest of which were magnitudes 3.2 (at 2:04 pm PST) and 3.0 (at 8:54 am PST). Following a pause in activity on Tuesday and Wednesday, another magnitude 3.2 earthquake occurred at 3:56 am PST Thursday (Jan. 14, 1999), followed by a magnitude 3.0 earthquake at 8:13 am PST. The largest earthquakes were felt at Timberline, Brightwood, Parkdale, and Mount Hood Meadows. A paper published in 2005 (J. Jones and S.D. Malone, Mount Hood earthquake activity: volcanic or tectonic origin, Bull.Seis. Soc. Amer. #95, 818-832) studied the early swarms in great detail. The primary conclusion of this study was that these swarms (maybe most) are related primarily to regional tectonic forces and do not necessarily have a volcanic origin.