Newberry


Newberry is one of the largest Quaternary volcanoes in the United States, with a caldera that spans 6 to 8 km across. The center of the volcano is located about 35 km SE of Bend, OR.
Construction of the volcano began about 400,000 years ago; since that time it has erupted in a variety of styles ranging from basalt flows to far-reaching explosions of ash. A major explosion and collapse event about 75,000 years ago created Newberry's summit caldera. The caldera contains multiple hot springs, indicating that it is still hydrothermally active. These hot springs and multiple youthful lava flows indicate that the volcano could reawaken at any time.
More background information on Newberry
Background Seismicity
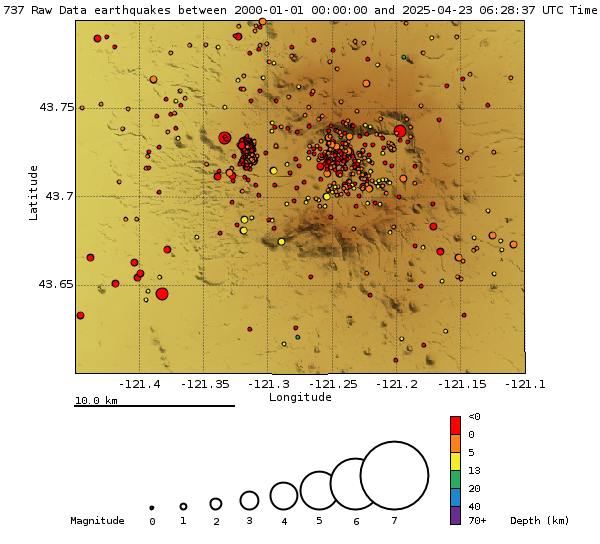
The Cascades Volcano Observatory and the PNSN cooperatively operate 8 seismometers in or near Newberry caldera. On average, we locate 0 earthquakes within 10 km of the volcano each decade.
Newberry Volcano Seismicity
Short-cut to spectrograms for Newberry Volcano
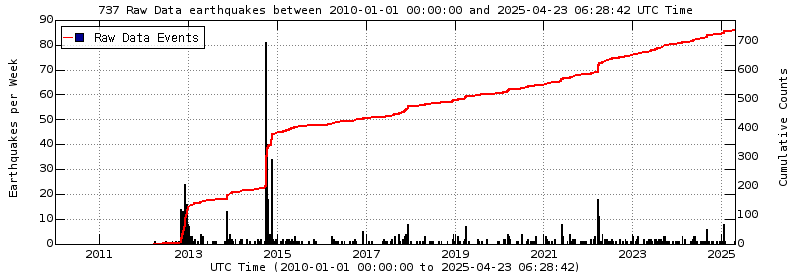
The only station located near Newberry before 2011 was NCO, located on the east flank of Newberry ~8 km ESE of the central crater. Before 2011 when more stations started to be added to the Newberry network only larger earthquakes (M > 2.5) could be located here. After 2011, when there were enough seismograph stations nearby very small earthquakes could be recorded down to less than magnitude 1.

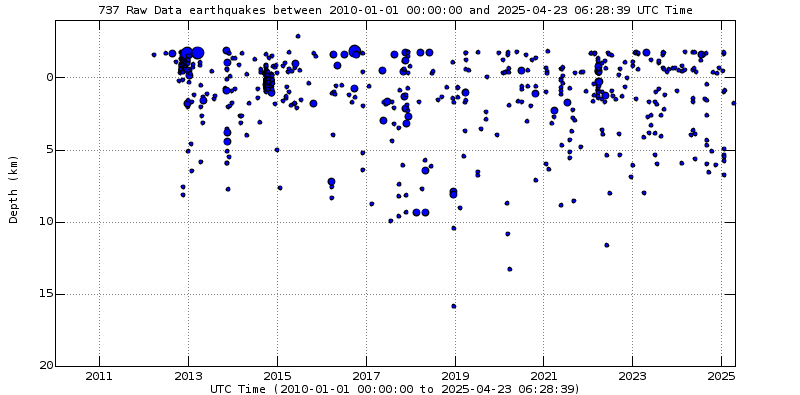
Below is a time-depth plot of events located near Newberry Volcano since 2000. This plot is updated weekly... unless, of course unusual activity takes place that suggests a different time sequence is needed to better interpret that activity.
NOTE: A depth of 0.0 (zero) km is at sea level and thus events within the volcano will plot above sea level (negative depths). See the blog for more details.

