Cascade Volcano Seismology - a Tutorial
Seismicity Tabs (upper right side) of each volcano page
The Pacific Northwest Seismic Network (PNSN) is the prime contractor to the U.S. Geological Survey for the seismic monitoring of earthquake activity in Washington and Oregon including the Cascade Volcanoes. In collaboration with the Cascade Volcano Observatory (CVO) we operate seismic stations on many of our volcanoes to help understand their activity. We offer special web pages for many of the volcanoes with 3 tabs each; 1)containing details on their current seismicity, 2) a description of the monitoring and general activity and 3) a detailed set of plots for the historical seismicity. This third tab (on the right) has recently been upgraded to use standard plots for both recent and historical seismicity. Because the level of seismic activity is quite variable at different volcanoes some of these pages are much more interesting than others. In particular, the seismicity tabs for Mount St. Helens, Mount Rainier and Mount Hood should be interesting to the aspiring volcano seismologist.
Each of these seismicity pages starts with three standard plots, examples are shown here:
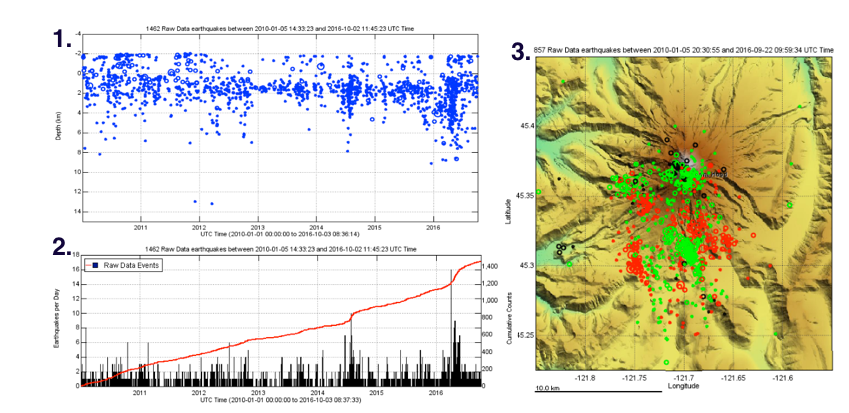
An explanation and some hints on the interpretations of these plots are as follows:
Time-Depth Plots - The depth of each earthquake at or very near a volcano is plotted on the y- (vertical) axis against time on the x- (horizontal) axis. Most of these plots start in 2010 and go up until the past week. The symbol size is proportional to the earthquake’s magnitude. This sort of plot is very useful for spotting changes in event depth over time. If there were a uniform progression from deep events to shallower one might be tempted to interpret this as a rising batch of magma that would lead to an eruption. In practice this is almost never seen. Pre-eruption seismicity typically starts quite shallow, and its depth may decrease very little or not at all and may not be very diagnostic. Deeper seismicity (below sea level) is thought to be associated with pressure changes in a crustal magma reservoir, either due to a sudden pressure decrease sometimes seen during and shortly following eruptions or due to pressure increase due to a new batch of magma coming into this reservoir from a much deeper source.
Seismicity Plots - Here the number of earthquakes per day (or week for longer plots) is plotted on the y-axis versus time on the x-axis as black spikes near the bottom. The cumulative number of earthquakes is plotted as a continuously, increasing red line. Periods of increased earthquake activity can be easily seen in each of these plots. A cumulative seismicity plot that gets steeper and steeper can be interpreted as a sign of volcanic unrest that will likely to lead to an eruption. However, there are other cases where isolated and often brief swarms of earthquakes will lead to a similar change in these curves that is unrelated to an impending eruption. A more gradual rise in this cumulative curve that is associated with deeper seismicity is usually interpreted as evidence of increased pressure in the crustal magma chamber perhaps due to a “recharging” batch of new magma arriving there.
Seismicity Epicenter Map - This is a map of the volcano with topography as background. The epicentral locations of earthquakes are shown color coded by depth and size is proportional to magnitude. The time period for this earthquake catalog may be less than the time used for the previous plots since showing more than a few hundred events on the same map becomes too crowded to easily interpret. Counterintuitively, these epicenter maps are rarely as useful for interpreting the volcano’s state of activity as the two time based plots mentioned above. Unlike Hawaiian volcanoes where eruptions can take place in rift zones extending away from the central crater, Cascade Volcanoes usually have a limited area over which they erupt, usually from near the center of the cone. However, the above example map for Mount Hood does show some distribution of seismicity to the south of the cone. At this time we feel that this earthquake activity is not directly related to volcanic activity but more likely reflecting regional stresses.
For some of our volcanoes there are additional similar plots to these three for earlier time periods. By comparing such plots for previous periods when there were eruptions (or maybe seismic activity but no eruptions) one can learn by example what the typical, normal or background seismic activity is like at each of our volcanoes.
The volcano seismologist has other information sources to use besides these, though some are not as easy to provide via web pages. Detailed waveform characteristics of earthquakes from volcanoes can give hints as to the source of stress causing the events. Besides earthquakes there are also a variety of “exotic” events that can shake the ground that challenges the seismic analyst interpretation abilities. There is a blog entry describing some of these. An experienced seismic analyst can recognize the characteristics of what are called “low-frequency” volcanic earthquakes, the type that often precede or accompany eruptions. Help with detecting changes can be provided by spectrograms which plot waveform amplitude and frequency against time.
Of course, interpreting the eruptive potential and/or the changing volcanic hazards depends on more than seismology. The PNSN works closely with the Cascade Volcano Observatory (CVO) whose staff monitor additional geophysical parameters such as the deformation of the ground surface (via GPS and tilt instruments), the composition of gases that may emanate from a volcano (via airborne sensors) and ground water chemistry. The experience of the CVO volcanologists and their knowledge of the variety of volcanic activity possible in general and specifically at a given volcano are critical for anticipating the type of potential eruptions and the hazards associated with them.
We hope that this blog entry and the ever improving information products provided on the PNSN and CVO web pages will help those interested in Cascade volcanic activity to understand what is monitored, how it is monitored and something about the complexities in interpretation. In a future blog I will give some of the detailed history of the monitoring and data from previous periods of volcanic unrest.