Why we should constantly watch the deformation of the seafloor
Scientists have yearned for years to plaster the seafloor around subduction zones with seismometers and every other kind of sensor imaginable. So far, most instruments are dropped from ships, then recovered to sift through the data months later. But driven by new initiatives that emplace permanent cables to carry down power and carry back data, such as John Delaney's OOI cable surveying the Cascadia offshore, better monitoring is possible.
We'll review the reasons offshore instrument have great value.
Watching the stress rachet up toward the impending M9
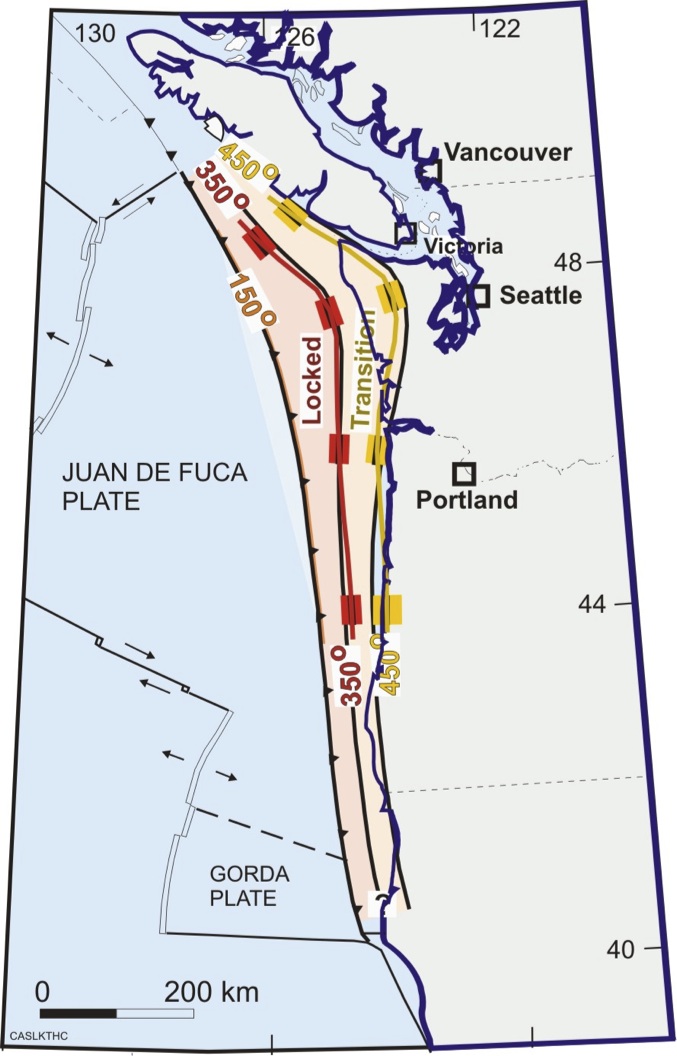
One important reason to plant submarine sensors is to watch the great Cascadia megathrust load in preparation for future subduction earthquakes. The locked and partly locked parts of the plate boundary, bound to break in our M9s, is shown in this figure (from Hyndman, PGC, 2012). Click on the figures to expand them.
The part of the plate boundary that is locked and loading lies mostly offshore, largely obscured from the view of our land-based seismometer and GPS networks. Instruments on top of and seaward of the locked zone would allow much more accurate estimates of the regions that will "pop" in future earthquakes, and assessment of the faults that are accomodating current earthquakes.
Incomplete monitoring in Japan (although much more complete than ours) allowed the farthest offshore part of one of their faults (the blue area on the inset map below) to load up to 100m (not a typo) of punch without anyone being aware of it. This momentous wallop powered the huge and deadly tsunami last year.
Watch for slow slip episodes transferring stress to locked patches
Even more compelling is the observation that the Japanese M9 earthquake was preceded by an M7 foreshock two days earlier, and ANOTHER M7's worth of slow slip, both near where the M9 started. The slow slip doesn't mean the M9 could have been predicted, but it would have set the Japanese on alert at the time of the M9, if they had spotted it.
These two figures tell the story (Sato et al., February 10, 2012, Science).
Essentially, in the two days between the M7 foreshock (black star) and the mainshock (which started at the yellow star), many small earthquakes located by yellow dots occurred in a region that was slowly slippng a lot. It was near the western (deeper) edge of the region with huge slip in the M9 mainshock (dark blue on inset figure).
In detail, the little earthquakes indicate that the slow slip motion migrated from the site of the M7 foreshock towards the site where the M9 started.
Here is a cartoon showing the interpretation (Ando, Earth, Planets, & Space, 2011).
If we can locate the places that are stuck, and spot the big slow slip episodes, we can differentiate times of greater from lesser danger.
I don't think the Japanese willl remain blind to such red flags in the future, and neither should we. This is their current plan for instrumenation off the coast near Tokyo (Nature, March 7, 2012).
Not every major earthquake has shown a pattern consistent with being preceded by slow slip, but the Turkish Izmit earthquake of 1999 is another example. 20,000 people perished in this M7.6 event that struck without warning, but several hours of tiny earthquakes and perhaps tremor were later found to have preceded it.
Rapid and accurate description of earthquakes
Another motivation for seafloor sensors is to watch the action during big earthquakes. Recording the way the seafloor moves is critical information for early warning of incoming strong shaking. The post-quake assessment of regions likely to have been hardhit and faults that have just been stressed by the big earthquake would also be more accurate with seafloor info.
Rapid and accurate description of tsunamis
The key measurements during big earthquakes include the water waves reverberating overhead for accurate tsunami warnings. Existing tsunami warning sensors on the seafloor are at a distance out to sea from earthquakes, warning us about waves traversing from Alaska or Japan towards our coast. More important but difficult is warning about the devastating waves locally that follow a local big earthquake. Recordings just above the breaking fault give the quickest and most accurate insight into those waves.
Raft of other surveys above the seafloor
One can imagine a boatload of other measurements of value - water temperature, trace chemistry, marine life, near-seafloor hydrology, etc., that become economical with a power and an ethernet connection web across the seafloor.
In June, 30 or 40 scientists will attend a workshop at UW sponsored by the PNSN and OOI to figure out the next steps for Cascadia.


