Landslide Study with Nodal Seismographs
A slow moving landslide on Rattlesnake Ridge in eastern Washington is being monitored using many different geologic and geophysical techniques including continuous, telemetered, real-time seismic stations. Details of the seismic monitoring are covered in the PNSN Observation blogs for the slow moving landslide in January and a follow-on set of posts in February and March. The few stations in this network have limited capability for locating detected events with high accuracy and thus only can help provide a rough picture of what is going on. With many station distributed near the landslide it should be possible to greatly improve the characterization of the seismic events being generated by the landslide.
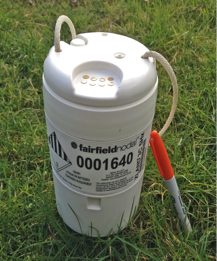
In mid-January of 2018 a group from the University of Oregon led by Amanda Thomas (the author of this post) deployed a network of 38 nodal seismometers around the slide body.Nodal seismometers or nodes are wireless, three-component, short-period (5 Hz) seismometers that weigh six lbs. each. The technology was developed by Fairfield Nodal primarily for use in exploration seismology, however nodes can be used to record a variety of seismic processes. Each node is approximately six inches tall, five inches in diameter, and has a spike at the base of the instrument that couples it to the ground.Each instrument takes approximately five minutes to deploy and the batteries, recording system, and GPS are all internal hence the setup is entirely cable-free.The (relatively) low cost of individual sensors allows for easily deployable, dense observation networks that produce high-quality data. Once the 30-day battery life is depleted the instruments can be recharged and data harvested in approximately four hours. While nodes are nominally 5 Hz instruments, they can record frequencies at or lower than 1 Hz and have a maximum recording frequency of 2000 Hz.Hence nodes are ideally suited for studying small magnitude seismicity emanating from the slide.We have been swapping out the instruments monthly so that they can continuously monitor tiny earthquakes coming from the slide area. Here is a photo of one of the nodal instruments.
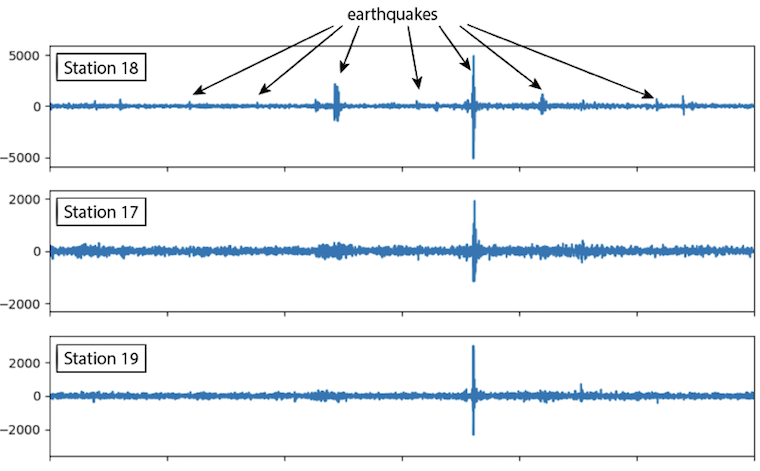
The initial station layout, shown on the left in the figure below, was designed to ensure that instruments were deployed suitably far from the active slide (30+ m) for safety and would not interfere with slide monitoring efforts.In the first few weeks of recording an abundance of earthquakes (~8 events/minute) were apparent on station 18, the station closest to the slide. However, only the largest amplitude events were still visible on stations 17 and 19 and rarely were detected on the more distant stations. At the end of this section is an example set of seismograms illustrating this point.
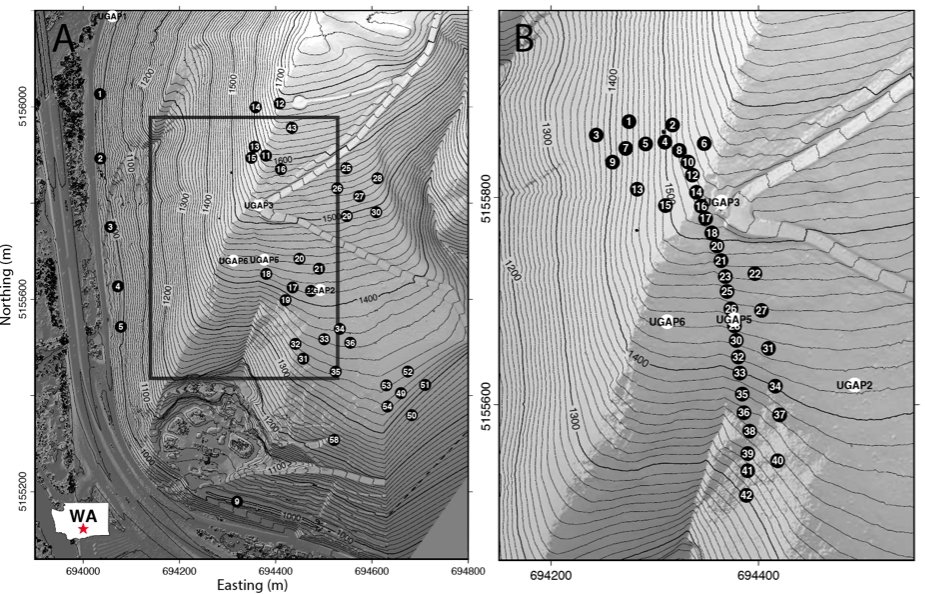
This observation suggests that the medium is highly attenuating and to record small earthquakes on many stations requires that stations be deployed very close to the lateral fissure.With that in mind, we reconfigured the network to the geometry shown on the right in the above figure, which places stations at ~20 m intervals all along the main lateral fissure and places several nodes in the diffuse head scarp region where new cracks are forming as the slide continues to deform.We call this layout the “crack attack”.The crack attack is still in its first 30 days but the UO group will replace the instruments and harvest the data by Mid-April.This network geometry should give much insight into the slide geometry and slide related earthquake activity.