A Space Junk Mystery - Maybe Explained
There have recently been a number of news reports, with dramatic predictions, of bits of human-launched debris returning to earth. Besides the Chinese booster rocket return (into the Indian Ocean) there was the streak of lights over Washington back in late March followed by parts of SpaceX Falcon rocket being found in a field near Beverly in eastern Washington.
Such things often attract the attention of seismologists, particularly those of us with a bent toward exotic (non-earthquake) sources. I finally got around to looking at seismograms in the evening (local time) of March 25 and WOW!! There were lots of strong seismic signals on many of the PNSN seismograms for stations in northwestern Oregon and southern Washington. I puzzled over these seismograms for awhile and found interesting signals on no fewer than 123 stations, and I have not exhausted all possibilities. However, I am still confused.
I can now say that I have a few wild ideas about what this sequence of signals means. They are certainly associated with the widely reported fireballs seen at roughly the same time. Their arrival patterns do not agree with any simple model of what took place (that I can come up with). I outline some of my observations below followed by some wild arm-waving guesses to explain them.
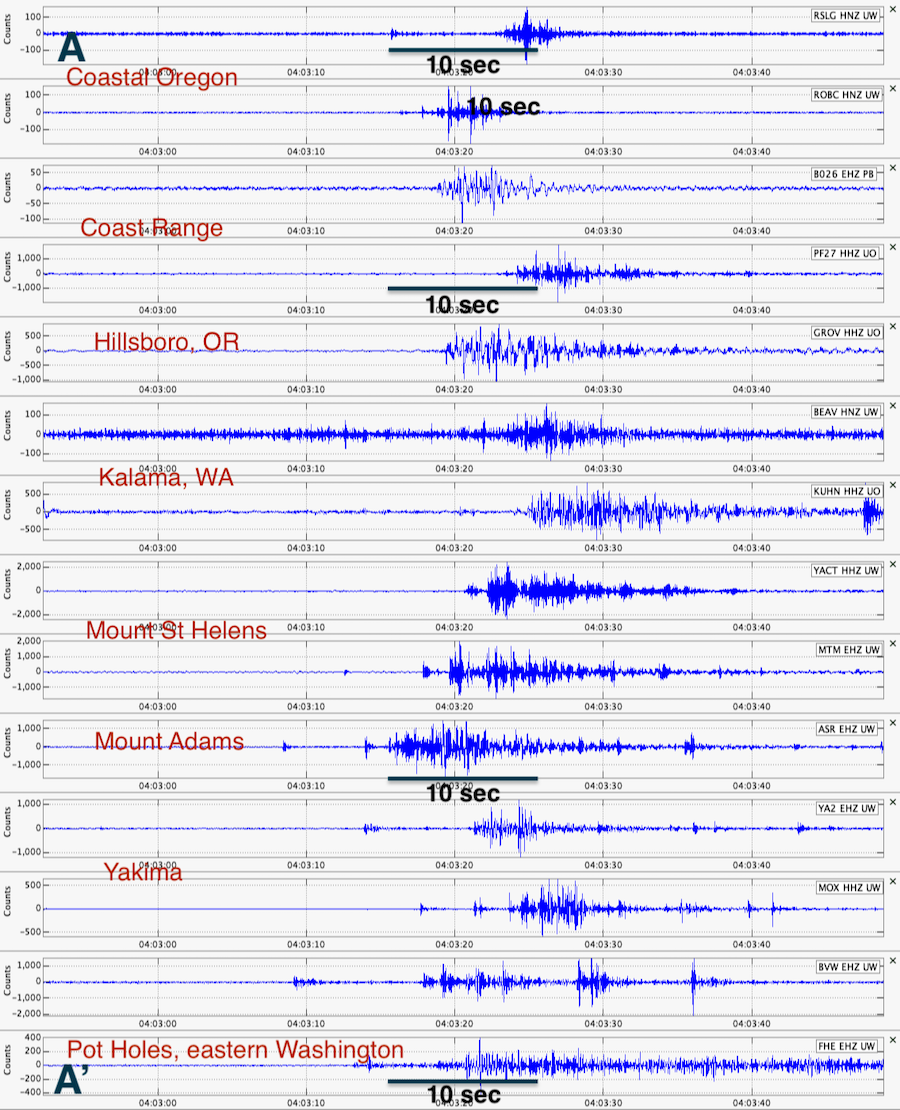
The following figure is a sequence of seismograms from stations going from near the northwest Oregon coast (top) through the Mount St. Helens and Mount Adams region to central Washington (bottom). Note the time scale. All stations have strong signals within 10 seconds of one another. These stations lie very close to a single line that is over 400 km (250 mile) long.

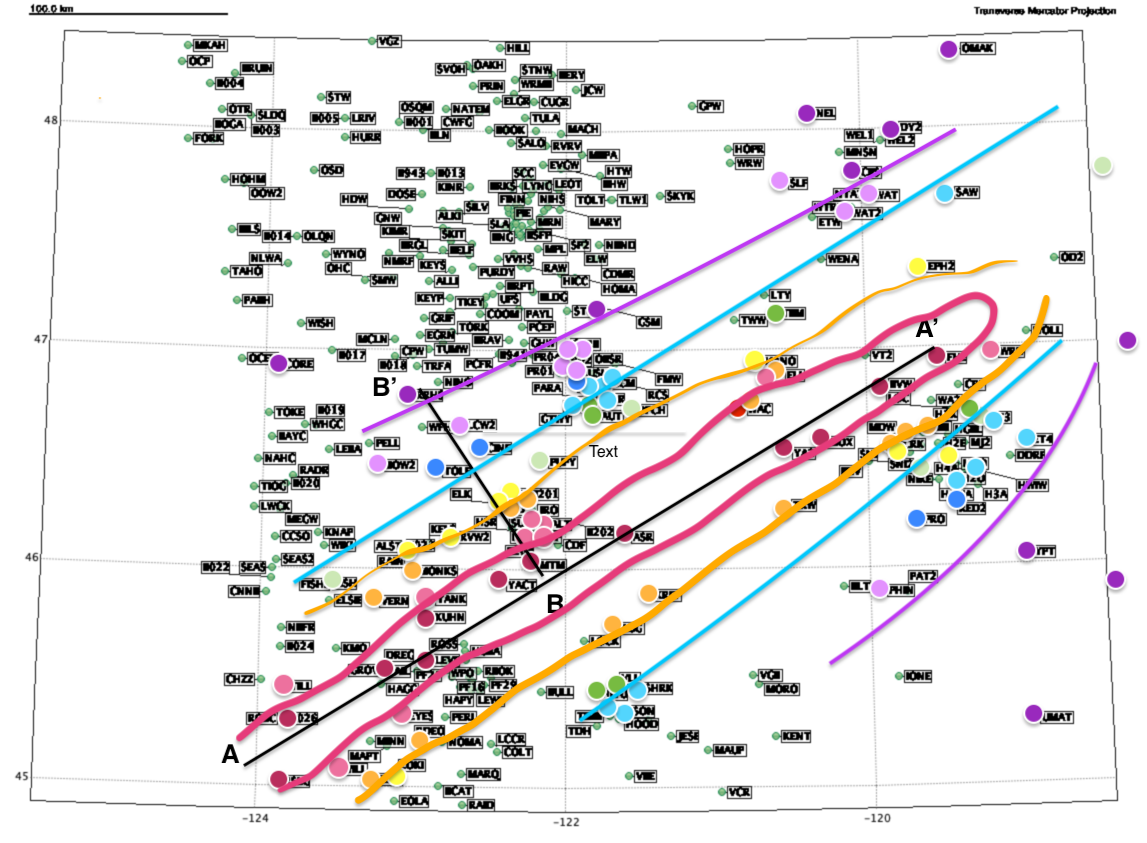
When the times of the main large signal on all stations is measured, a very strange pattern emerges. In the next figure I have plotted the stations color-coded by the arrival time of the strong signal, but lumped together in 10 or 20 second bins by color such that all stations within the first 10 seconds are red, the next 10 second bin is pink, the following 20 second group is in orange and so on with the latest signals in dark purple. I have tried to contour the separation of colors with the colored lines.

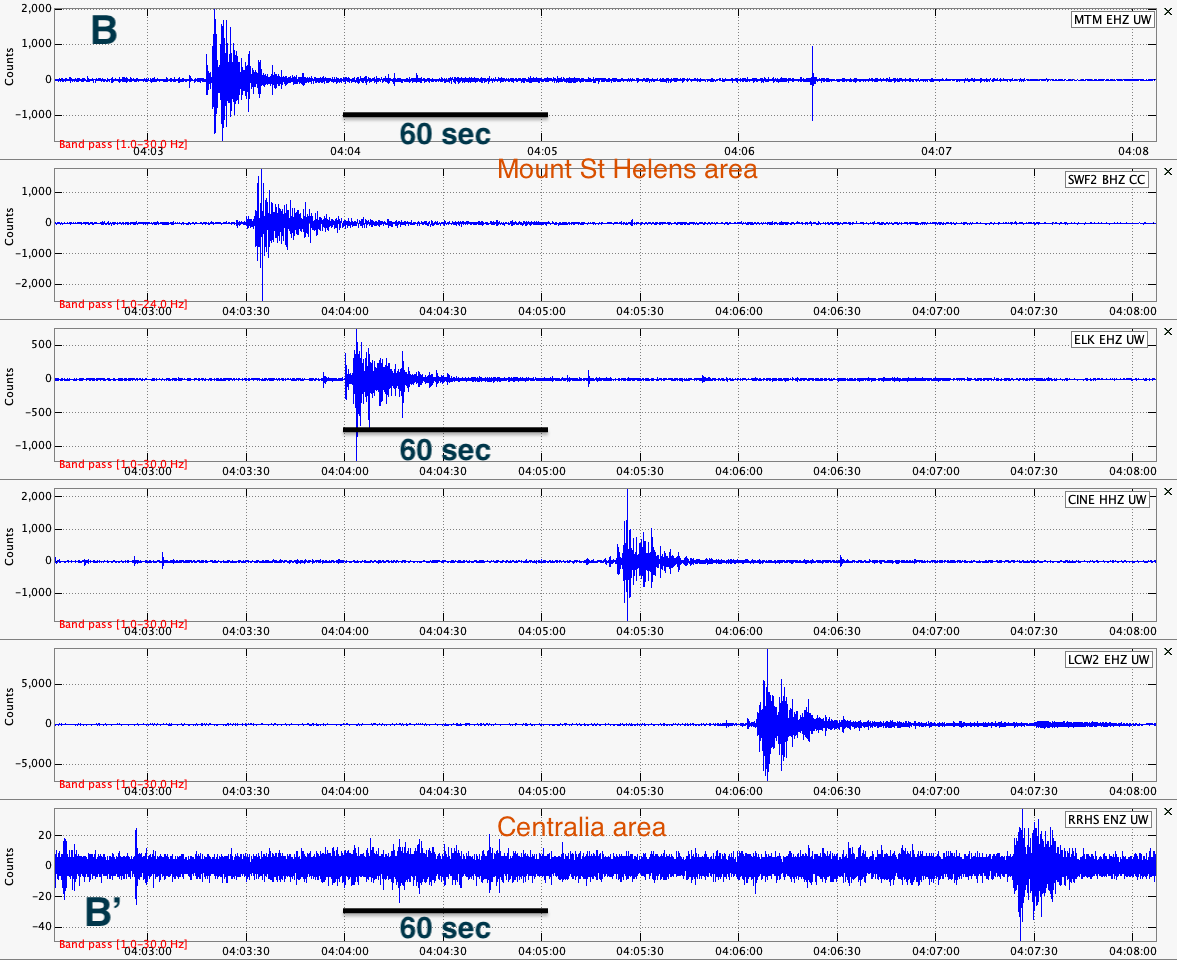
This pattern looks as if there is a near simultaneous seismic source all along line A - A’ and then much later signals arriving perpendicular to this line. The following figure is of seismograms for stations along perpendicular line B - B’ going from near Mount St Helens to a station north of Centralia, a distance of only about 100 km (60 miles). Again, note the time scale. The time between the first and last strong signal is almost 4 minutes (240 sec).

So the question is: how do we explain this strange set of arrival times? It turns out that there are three known ways that meteors, fireballs or space junk can generate a seismic source. Of course, if anything impacts the earth with enough momentum it could shake the ground in much the same way an earthquake or mining explosion does. We can rule out such a source in this case, at least for the main, large signals. It is possible that some of the very small impulsive signals seen on some seismograms could be from such an impact source, but this is not likely.
A second possible source mechanism is for an object to explode when it is suddenly heated by entering the atmosphere. Such explosions have been seen and reported around the world, and a previous blog post goes into some detail of one of these back in 2018. In such cases the pattern of seismic arrivals is more circular like ripples on a pond if a rock is dropped in. The explosion occurs at a single place, and the air waves generated travel outward in all directions arriving at the ground in a circular pattern.
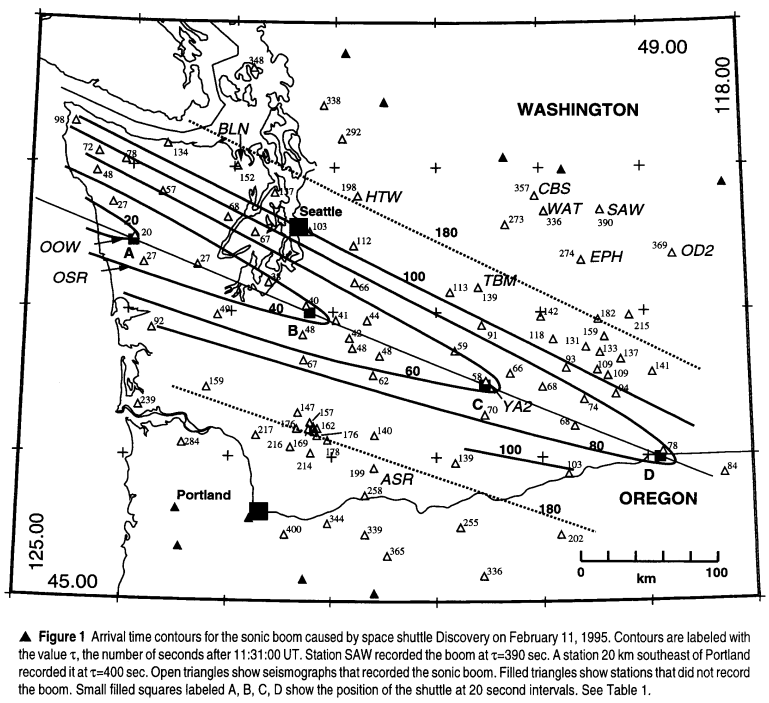
In our space junk case this is clearly not what has happened, which brings up the third way that atmospheric sources can generate seismic arrivals at seismograph stations. This is the case of sonic booms. When an object (airplane, rocket ship or meteor) travels through the air faster than the speed of sound, a “shock” wave is generated that travels away from the source in a conical pattern. An excellent paper by my former colleague, Tony Qamar, studied the seismic arrivals generated by the space shuttle Discovery traveling over Washington on its descent to land at Cape Canaveral, Florida in February 1995 (Qamar, Anthony, “Space Shuttle and Meteroid--Tracking Supersonic Objects in the Atmosphere with Seismographs”). Tony also studied the seismic arrivals from an exploding meteor which had a very clear circular pattern for its airwave arrival times.
Below is a figure from Tony’s paper of the arrival pattern for the space shuttle. It has some similarities to the map figure above of the recent space junk arrivals.

What is clearly different between the space shuttle generated arrivals and those of the recent space junk is the speed along the line of earliest arrivals. For the space shuttle it takes over 60 seconds from the earliest arrival to the latest along this ~400 km line, implying an apparent horizontal velocity of almost 7 km/sec. This agrees very closely with the speed as reported by the Johnson Space Flight Center, of 7.2 km/sec as it passed over Washington. The very obvious hyperbolic pattern of wavefronts is exactly what is expected for the shock wave from a single supersonic object traveling in a near horizontal trajectory.
In our space junk case, having all arrivals within 10 seconds along a line of similar length (A - A’ in the multicolored figure) implies a minimum velocity of 40 km/sec, much faster than is reasonable. I puzzled over this problem for quite a bit until I mentioned it to my wife, Linda (not a seismologist nor space cadet) who said that it seemed to her it must be a bunch of junk strung out along a line entering the atmosphere at about the same time. This seemed a cop-out to me at first, but the more I thought about it the more this seemed reasonable. It is clear from the seismograms that the seismic signals are complex, more so than for a single sonic boom source. From the earliest arrival at a single station some signals can be seen for almost a minute later (though the high amplitude part doesn’t last much more than 10-20 seconds). The earliest arrivals are near Mount Adams, with later arrivals both west and east of this one in a complex pattern.
OK, so if it is a line source entering the atmosphere at roughly the same time it could explain the complexity of the seismograms and their almost simultaneous arrivals along the line A-A’. It would also explain the much slower arrivals perpendicular to this line, for example along line B - B’ where the apparent velocity is more like 0.4 km/sec (240 seconds to go about 100 km). This is not much faster than the speed of sound in air of 0.32 km/sec, which would be very appropriate for a source in the upper atmosphere.
So, spread out space junk is a possible explanation. This is consistent with many of the reported visual sightings of a streak of bright spots traveling across the sky in a line. In fact, one of our staff caught a video of these strange lights - a 10 second clip from the almost one minute long video is included here. This is still not completely satisfying, since to get a bunch of space junk to enter the atmosphere along a 400 km long line all at about the same time seems far fetched to me.
