Mount Adams
Mount Adams is a potentially active volcano located 50 km east of Mount St. Helens, and is the second highest peak in Washington State. Although it has not had a major eruption in 1,400 years, it is not considered extinct. Thermal anomalies and gas emissions at the summit indicate that Mount Adams is still active.
Except for Mount Shasta, Mount Adams is the largest volcano in the Cascades by volume. Nearly all of its eruptions have consisted of lava flows with little to no tephra. Parts of the main cone consist of rock weakened by hydrothermal alteration. There is potential for large landslides of this altered rock to generate mud flows and lahars that flow far down valleys.
There was a large debris flow avalanche in 1997 at Mount Admas that was well recorded seismically.
More information about Mount Adams from CVO
Background Seismicity
The PNSN operates 3 seismometers near Mount Adams. On average, we locate 3 earthquakes within 10 km of the volcano per decade.
Mount Adams Seismicity
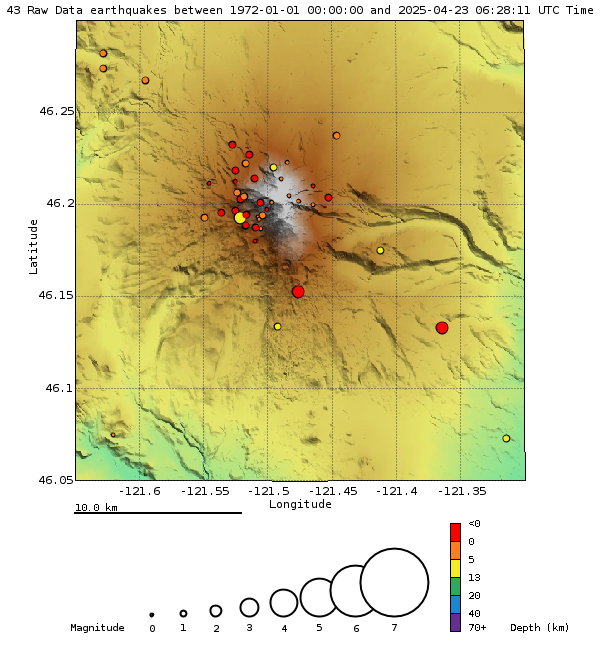
Below you will find an epicenter map, a time-depth plot and a count of earthquakes plot for the immediate Mount Adams area. These plots are for the time period since 1972. However, it was not until the 1980s when there were seismograph stations near enough to locate earthquakes at Mount Adams. The only station located on Mount Adams, ASR was installed in the summer of 1982. Compared to many of the other Cascade volcanoes Adams has one of the lowest rates of seismicity. There is some significant seismicity to the northwest off this map but it is not considered related to Mount Adams in any way.
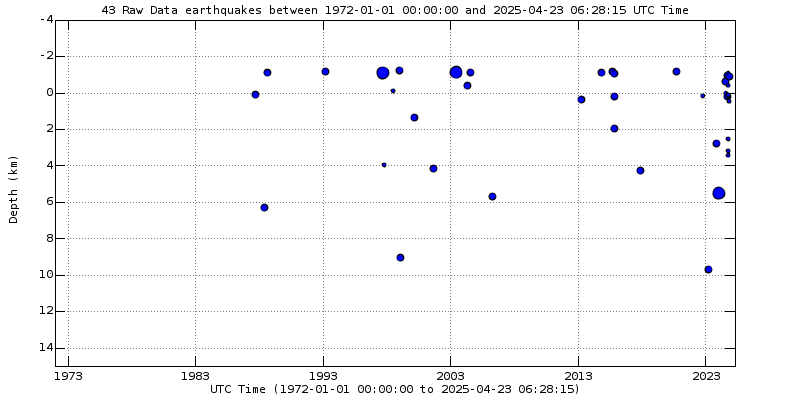
Below is a time-depth plot of events located directly under Mount Adams since 1972. This plot is updated weekly... unless, of course unusual activity takes place that suggests a different time sequence is needed to better interpret that activity.
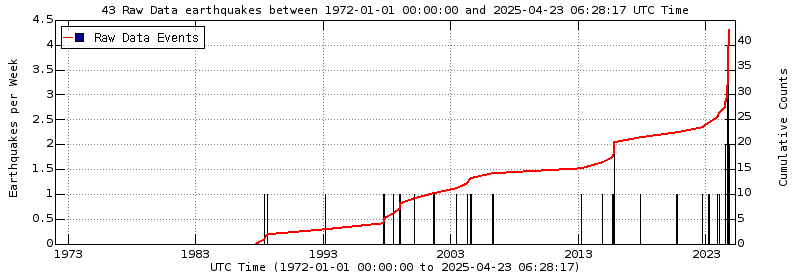
Here is a seismicity plot that shows the number of located earthquakes per week (black spikes) and the cumulative number of earthquakes over time (red).
Debris Avalanche at Mount Adams, Washington
Seismic recordings of the 10/20/97
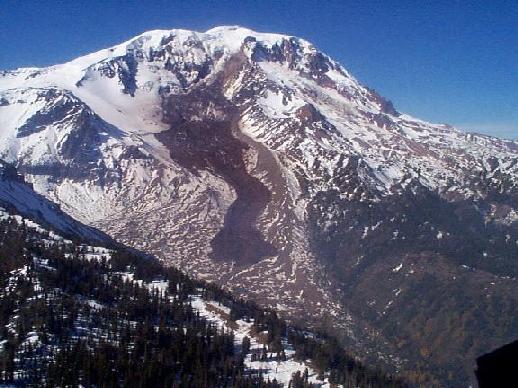
Photo courtesy of Gifford Pinchot National Forest
At 12:31 AM PDT on October 20, a large mass of rock fell from the Castle, a prominent rock formation east of the summit of Mount Adams. This avalanche was recorded on many seismograph stations of the Pacific Northwest Seismic Network in southern Washington and northern Oregon, and some examples of the seismic signal from five broad-band stations are shown below. The table below the signals indicates where each of the stations are located, and their distance from the avalanche source area on Mount Adams.
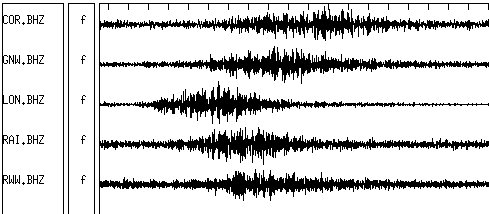
| Station | Location | Distance, km |
| COR | Corvallis, Oregon | 230 |
| GNW | Green Mtn., Washington | 183 |
| LON | Longmire, Washington | 66 |
| RAI | Trojan Power Plant, Oregon | 110 |
| RWW | Satsop, Washington | 180 |
The total time window shown is 195 seconds; the signals shown have durations between 80 and 110 seconds. The total time duration of motion for this avalanche is estimated to be about 6 minutes, based on recordings from the closest seismograph station (not shown). The elongated, spindle-like shape of the signals is typical of large avalanches; this characteristic shape helps seismologists to differentiate them from earthquakes, which typically display one or more sharp peaks in amplitude, after which the signal decreases smoothly back to the level of background "noise" typically seen at each station.
According to the USGS Cascade Volcano Observatory (CV) this avalanche originated at about 11,200 ft. elevation on the south face of The Castle, a prominent topographic knob at the head of Battlement Ridge. The source area forms an obvious, near-vertical scar roughly triangular in shape with sides about 300 meters in length. The avalanche traveled beyond the end of the Klickitat Glacier and continued roughly 2 kilometers down the valley of Big Muddy Creek, a tributary of the Klickitat River. The length of the avalanche track totals about 5 kilometers, with an average width of .5 km. The volume of debris is estimated to be between 1 and 5 million cubic meters. The avalanche deposit temporarily blocked the flow of Big Muddy Creek, avalanche debris. By noon on October 21 the avalanche dam had breached, and flow in Big Muddy Creek did not appear unusual.
Avalanches in late August, 1997
The debris avalanche on October 20 followed an earlier sequence of debris avalanches from the Avalanche Glacier on the southwest side of Mount Adams. These avalanches occurred between August 29 and 31, and consisted mostly of ice from the Avalanche Glacier. In late August, 1997, a section of the Avalanche Glacier 1 km long and 300m wide detached from the upper southeast slope of Mount Adams, generating a large debris avalanche. The avalanche descended the glacier and continued into the heads of Salt and Mud Creeks below timberline, leaving a deposit with an average length of 4 km, exceeding 5 km in places. Field observations made by geologists from the Cascade Volcano Observatory (CVO) indicate that the avalanche deposit consisted mostly of glacier ice and snow, blanketed by a veneer of sand, clay, and rock debris scoured from hydrothermally altered rock underneath the glacier. The bulk volume of the deposit is estimated to be approximately 5 million cubic meters.
The avalanche generated three seismic signals, indicating that glacier ice and rock debris fell from the Avalanche Glacier at least three times- first at 0035 PDT on 8/30, and again a day later at 0631 and 0635 PDT on 8/31. These times agree with reports from hikers, one of whom witnessed the fall of the largest avalanche at 0635. Although they are visible on helicorder records from most stations in southern and central Washington and northern Oregon, these low amplitude signals were not digitally recorded, and were not recognized by seismologists until a search was made for them after the avalanche. The most distant station on which the signal is visible is JCW, 224 km from the avalanche source. The signal amplitudes and durations increased during the sequence from an average of 60 seconds and 1mm for the first event to 110 seconds and 2mm for the third. The increase in signal size with time indicates that each successive pulse of the avalanche was larger in volume.
The cirque that contains the upper Avalanche Glacier has been the source of two other large avalanches since 1900. An avalanche in 1921 left a deposit of 5 million cubic meters of altered rock debris on the southeast slope of the mountain, and a previous collapse of the upper Avalanche Glacier on July 15, 1983 left a deposit of icy rubble similar to but smaller than the August 1997 deposit.
For more images and detailed information on the Mount Adams avalanches, see the web pages produced by the Cascades Volcano Observatory.
For more information on the seismic signals generated by large avalanches, see Seismic detection and location of debris avalanches.