Three Cascadia ETS events in past month??
There is a 9/5/2014 update and a 9/11/2014 update
Here is a plot of most of the past month of tremor locations in Cascadia color coded by time (red - most recent, blue oldest).
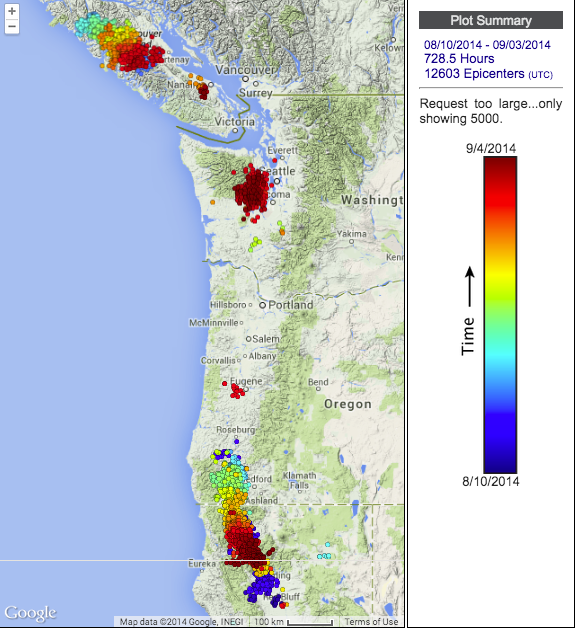
This plot is for the period, 8/10 - 9/4/2014 but not all sections started at the same time. The first segment to light up was in northern California starting on Aug 10 with scattered activity stretching from near Red Bluff almost to the Oregon border. There was then a couple of days break before it jumped up into southern Oregon half way between Roseburg and Medford and then mostly progressed smoothly to the south.
The next section to start was in central Vancouver Island. This sequence started with a burst in both the north and south on Aug 15 and then the northern part continued and smoothly moved south. This appears to have stopped on Sep 2 but a burst further south near Nanaimo started up about the same time the main burst was dying out.
And finally the northern Puget Sound (traditional 14 month ETS zone) started up on Aug 23. It started in southern Puget Sound on the down-dip side and then seems to have migrated up-dip and spread slightly to the north and a bit to the south. This may be an inter-ETS event and die out in the next couple of days. If it is the start of the main ETS event then it is early. The previous main ETS event went from Sep 7 to Oct 8, 2013 and so this would be less than a year between events.
We have not yet heard anything from any geodesists about detecting actual slow-slip accompanying any of this tremor. This blog will be updated if we hear anything or more interesting patterns develop.
Update #1 - 9/5/2014
After posting this blog yesterday I heard from David Mencin and Kathleen Hodgkison of UNAVCO. They report that strain meter site B018 (just south of Olympia) is showing a typical slow-slip strain event.
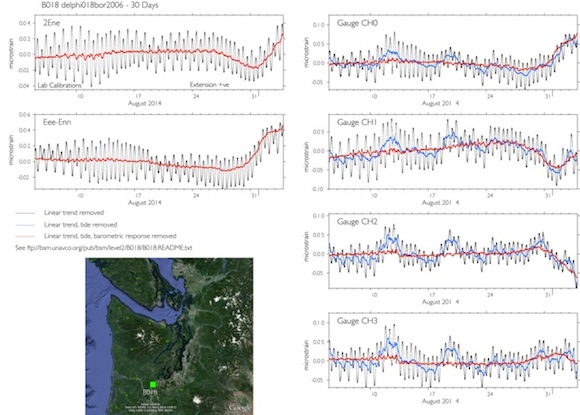
Here is the 30-day plot from strain site B018. The smoothed (red) curve clearly shows the transient strain event starting by at least Aug. 27, only two days after the ealiest tremor. The higher frequency regular oscillations (black curve) are the strain due to solid earth tides (pull of sun and moon). Other plots of this instrument and all of the UNAVCO strain instruments can be found at the UNAVCO strain data web page.
While not yet having heard from GPS geodesists and not being one myself and thus reluctant to interpret their data I can suggest looking at the PANGA web site for very nice displays of GPS data
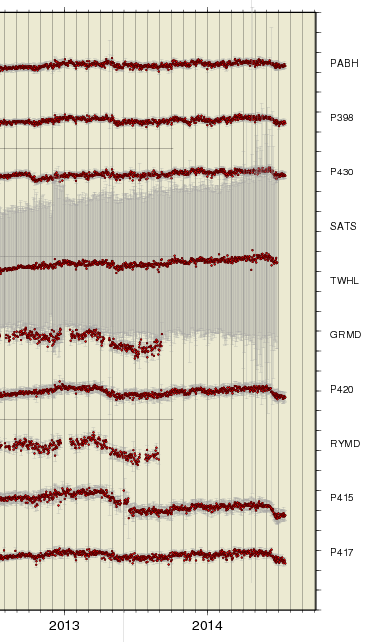
Here is a plot of the last couple of years from the longitudinal component of the Willapa Hills (WWH) grouping of stations from PANGA. Note that, in particular for stations P430, TWHL, P420 and P415 there seems to be an obvious and sudden downward (west) jump over the latest several weeks. However, if the time scale is correct then this change seems to have started back in June (month 6) so there must be something wrong with the plot or my interpretation.
OK, maybe the Puget Sound activity is NOT the main 14 month ETS starting early. It seems to have died out about three days ago without propagating very far at all. The fact that there appeared to be some geodetic motion seems strange for such a short tremor episode (just over 2 weeks), but there have been a few other similar episodes in the past. The Vancouver Island tremor did not continue but the northern California set is still going on.