Panther versus Seahawk Game Analysis
Seismic Analysis of the NFC Playoff Game between the Seattle Seahawks and Carolina Panthers
Saved Hawk-O-Grams (seismograms) for this game
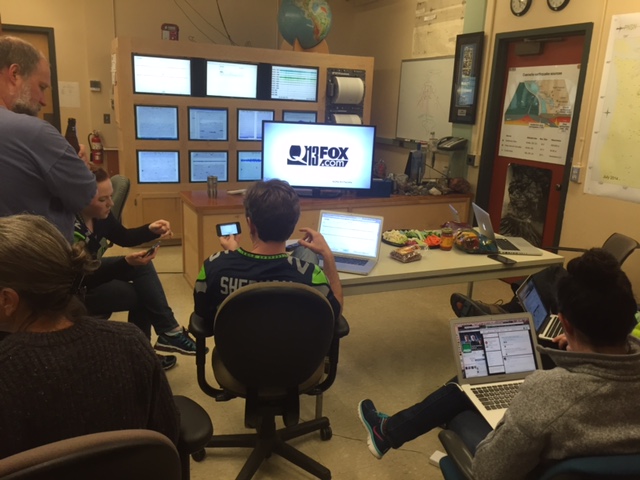
Up to seven PNSN staff were in the lab on Saturday evening and three were at CenturyLink Field, the latter to keep care of the instruments and to report on what was going on in the stands that might make interesting seismic signals. Of course the old reliable Hawk-O-Grams proved a great over view of the whole game, complete with annotations for critical plays. Those of us in the lab could see all three seismic displays on screens along with the TV broadcast. Since the TV has a built in delay of at least 10 seconds we could see the crowd reaction to a big play on the QuickShake seismic display before we even saw the play start on TV. Thus several times we would be cheering long before the play developed because we already knew it would be a good one. We heard from many fans at home they were having the same experience and loved it.
However during the first half there was a lot of frustration by many as well. We could watch the number of users connecting to QuickShake and by game time it was getting into the 100s of users. The displays started having dropouts and some times would seem to just quit. We contacted the Windows Azure Cloud Service of Microsoft, the same group who helped us last year. They again volunteered to help us and made some changes in the way the real-time feed was distributed during the half time break. During the second half the dropout problem mostly went away and we saw as many as 2,000 users connected at the same time.
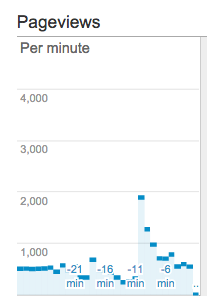
Here is an example of the number of users connected over time. Note the sudden jump up to almost 2,000 views per minute. This corresponded to the time of the Cam Chancellor interception and TD run toward the end of the game. It would seem that seeing this on TV got a lot of people interested in what it might look like on the seismographs and so connected to look. Of course the traces just start to appear when the connection is made so it would have been after the interesting signals were over.
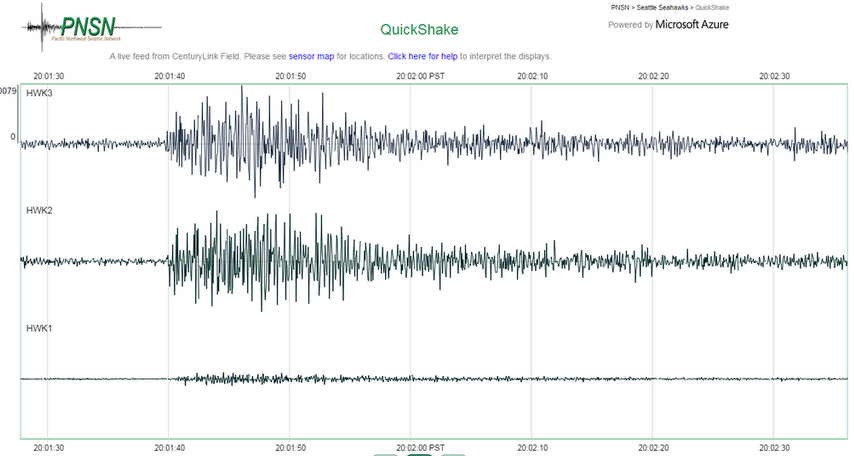
But, if you were watching before then, this is what you saw. The image above shows the signal generated after Kam Chancellor's 90 interception touchdown. Note that both HWK2 and HWK3 are in the upper deck where crowd response of the stadium is significantly bigger than at HWK1, on the ground floor.
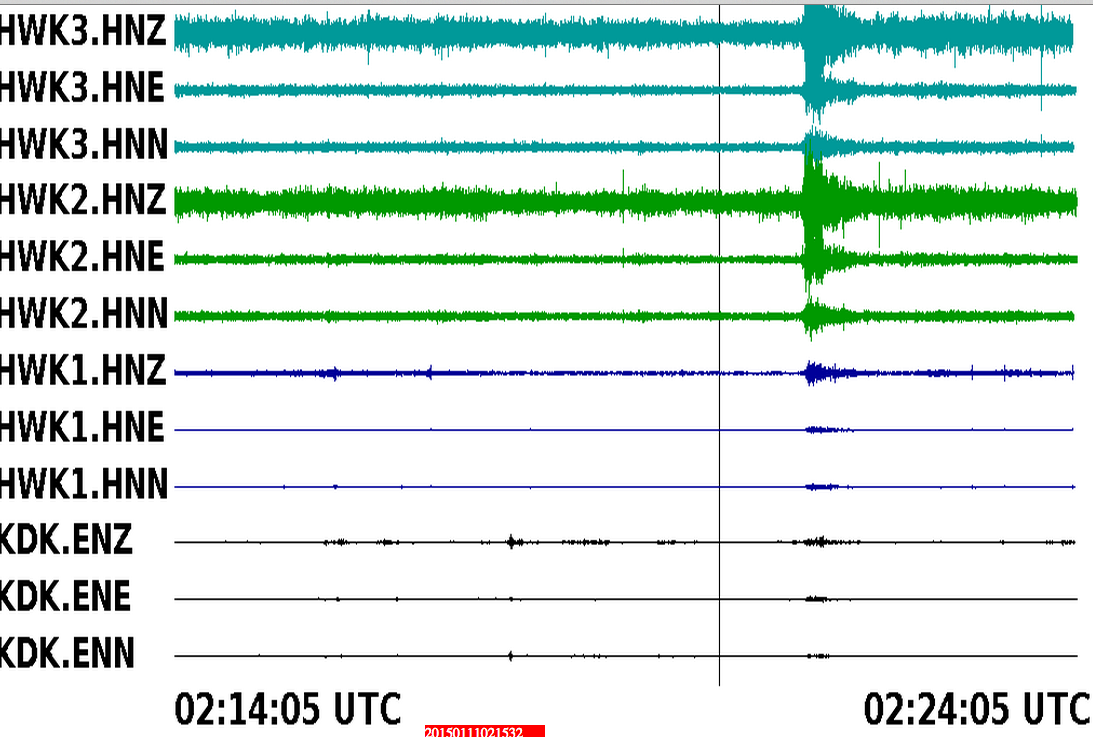
A pass was intercepted by Earl Thomas before half time (disallowed on further review). This video shows that QuickShake displayed the seismic signals created by the Seahawks fans in CenturyLink Field within two to three seconds of the crowd reaction.
The QuickShake display is only 90 seconds long and only the vertical channel of the three instruments in the stadium. The fan-o-meter2, while delayed by 10 seconds and so not useful for TV "Early Warning", shows all three channels of four stations and lasts for 10 minutes. Thus it is useful to see a longer period of time for what the crowd does over several plays.
Here is a sample of the Fan-O-Meter2 during the first half. It shows fairly high levels of fan activity gradually diminishing over several minutes but near the end is an obvious bigger burst of fan activity that is well recorded on all stations including KDK, which is outside the stadium. This corresponds to the Kearse catch and TD run.
Of course this is all very interesting but we did learn some other interesting things. The new instruments that we put in performed very well with a side-by-side test of one showing almost identical waveforms to that of our older, standard one. We are still doing some comparisons between activity recorded during this game and that from previous ones. This blog will be added to as more analysis is completed.
Some more analysis:
The Interception and TD run of Cam Chancellor seems to be the biggest signal during this whole game. A shorter Beast Mode run of Lynch generated a mini-Beast Quake but Cam's run seems to have really gotten the fans jumping up and down.

Here is a snip from the Hawk-O-Grams showing it (on the green line). The Wilson to Wilson pass for a TD about 9 minutes earlier was also pretty big but still not as big. So how does this compare with the original Beast Quake of 2011. One of our star seismology grad students (and Seahawk fan), Kelley Hall did a comparison:
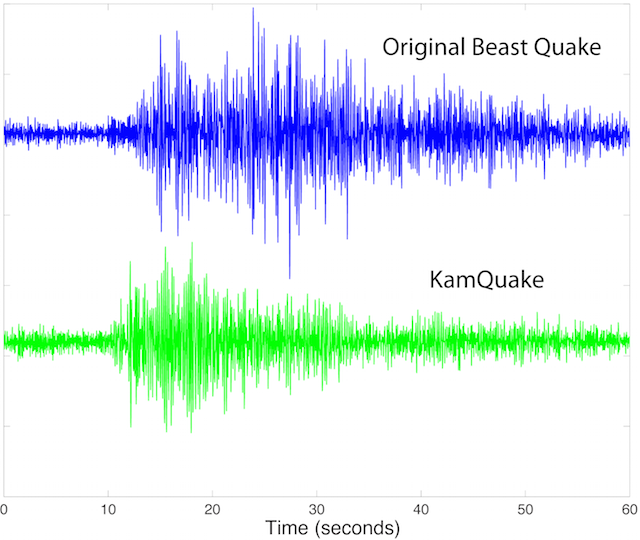
One of the important questions to answer after Saturday’s game is, Was the "Kam Quake" bigger than the original Beast Quake? There is one station that can give us this answer, KDK, located just blocks from the stadium. This station captured the original Beast Quake in 2011. In the figure you can see the Beast Quake plotted in blue above the most recent "Kam Quake" in green. By plotting the two signals we can see that the original Beast Quake remains the largest signal we have seen out of Century Link so far both in duration and maximum amplitude. We look forward to continuing to monitor for any further activity Hawks Fans can create.
Dance Quakes
Now for something a bit more esoteric, "Dance Quakes". Similar to last year we observed some strange signals on the seismograms that didn't seem to match up with anything on the field but were pretty energetic. Few and only small signals of this type occurred in the first half. But after the "Kam Quake" we saw an extended set of these strange low-frequency signals. In the Hawk-O-Gram snippet shown above you can see several bursts of energy following the initial big one. They come and go and seem to stop about 4 minutes later. On this plot you can't tell that they are different but using spectrograms they really show up with a different frequency content.

Here is a 6-minute spectrogram from all four stations (click on it for a bigger version). This figure plots the energy level (by color) versus frequency content (on vertical axis in Hz) versus time (horizontal axis in UTC time (PST+8) so 04:02 is 8:02 pm PST). Note that early in the record (from 04:01:30 until about 04:02:20) the plot is very red at all frequencies. This indicate wild random jumping up and down of the fans. Note that later on, starting about 04:03:20 and lasting until about 04:06:10 there are a sequence of horizontal bands of red at frequencies around 2 Hz and a bit more than 4 Hz. They are actually at slightly different frequencies at different times. This sort of regular or harmonic signal represents some motion by the fans that is well coordinated. Watching a short video clip taken by one of our staff at the game from the press box one can hear a drum-like sound beating very regularly and many fans (and the cheerleaders) jumping, clapping, waving more or less in time to the drum. The drum beat is just slightly over 2 beats per second and so this would fit. This drumming and dancing stops and starts several times on the video similar to what we see on the spectrogram. Ah Ha. Dance Quake proven. We feel it is very unlikely that the drum itself is being seismically recorded since the Dance Quake signal shows up quite well on KDK, which is in a separate building a block from CenturyLink Field. It must be the fans motion in time to the drum that shakes the whole stadium and the ground around it.
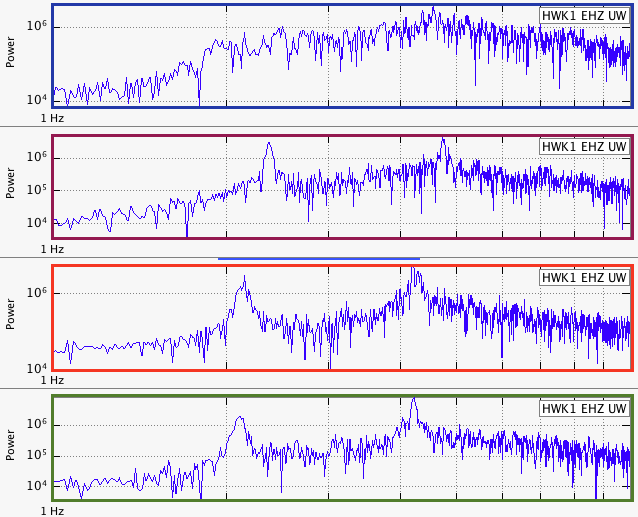
The narrow frequency band of the "Dance Quakes" can be see in a frequency plot of four different times (all from the same stations, HWK1). This is a plot of frequency content (FFT) scaled logarithmically of four different 90 second windows shown by the colored bars at the top and bottom of the specrograms. Note that the first (blue box) has a broad spectrum going from about 2Hz to over 8 Hz with no obvious big peaks. The next one down (red box) has strong peaks at 2.4 Hz and 4.8 Hz while the last two (orange and green box) have strong peaks at 2.1 Hz and 4.2 Hz. In the last case the 4.2 Hz peak is quite narrow and strong. We are not sure why two frequencies that are exact multiples show up without even higher ones. More thinking and maybe more experiments are needed.
Stadium Response
OK, here is one more bit of analysis, but may be only of interest to structural engineers. With instruments in the upper decks and on the ground floor we can see how different parts of the stadium respond to crowd motions. By looking in detail at the waveforms we find some interesting observations. It turns out that during wild crowd excitement such as a "Beast Quake" or in this game a "Kam Quake" the stadium motions see quite random. There doesn't seem to be much coorespondence between the signals on different stations. However, for "Dance Quakes" it is a different story.

Here is a set of two traces each of about 10 second duration from all four stations during the biggest part of a Dance Quake (click on it for a bigger version). I have put two vertical lines on it to aid your eye lining up similar motions on all components. The two traces from each station coorespond to the vertical (HNZ) and east-west (HNE). Note that at HWK3 the motion is up and east followed by down and west while at HWK2 the motion is the reversed; ie up and west followed by down and east. This indicates to me that the upper decks are flexing in response to the crowd motions. Since they are facing in opposite directions the flexing motions will be opposite to one another. Not pictured are the north-south components which generally show much smaller motions and not lined up with other components at all.
Now note the motions on HWK1 and KDE. When the upper decks move up the ground floor (and ground outside the stadium) moves down and west. Both of these instruments do more or less the same thing even though they are on opposite sides of the stadium. Note that these motions are also five to ten times smaller amplitude than those in the upper decks. My interpretation is that most of the "Dance Quake" motion is generated by the crowds in the upper decks who move together even on opposite sides of the stadium. This motion transmits to the ground floor but with opposite phase since its a reaction to the flexing of the upper decks. Not being a structural engineer nor knowing anything about the stadium design this is mostly some wild arm waving by this seismologist..... but seems reasonable.
Oh, yes we will be back next week for the NFC Championship game against Green Bay Packer. Go Hawks!