Renewed seismic activity near Bremerton
Four days ago, on Tuesday morning December 15 at 8:27am local time, a small (M3.2) earthquake popped off 25.9 km (16 mi) below Bremerton. Hundreds of people felt the very light shaking it caused at the surface, according to the USGS’s Did You Feel It? webpage. This main shock was followed by 13 small, unfelt aftershocks, including a M2.4 this morning (Saturday, December 19, at 7:30 am local time).
This was not the first time residents near Bremerton experienced an earthquake that happened right beneath their feet. In 1997 there was a M4.9 earthquake in this area that was felt over a very wide region (see for example this Kitsap Sun archived article and our event page M4.9 Bremerton EQ). In May of 2017, we had a swarm of earthquakes in this same region and I wrote a blog post about why it was difficult to figure out how to relate the earthquakes to the Seattle Fault Zone (see blog post: https://www.pnsn.org/blog/2017/05/11/earthquake-swarm-ne-of-bremerton).
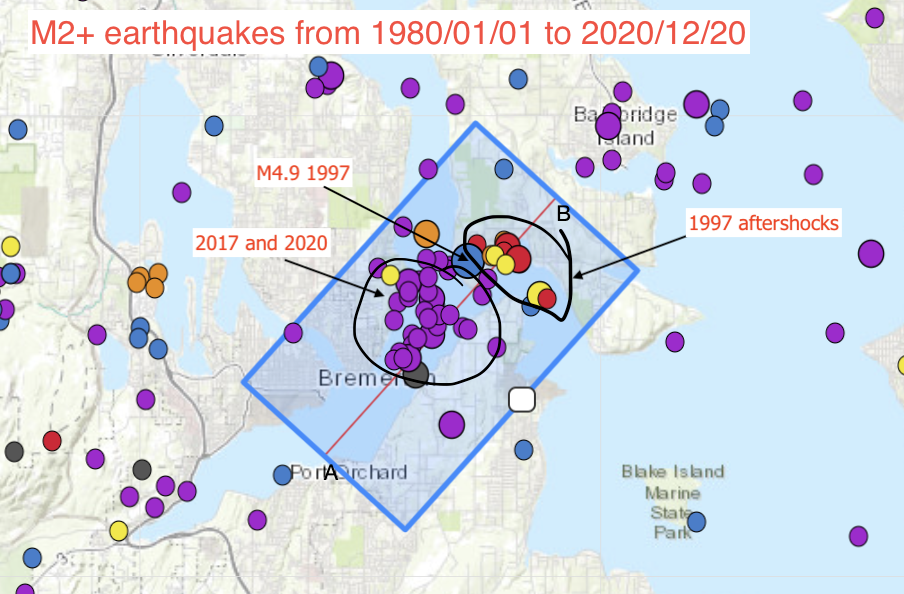
In this post I focus on the history of seismicity in this particular area as recorded by the PNSN. The circles on the map below show all the earthquakes of magnitude 2 or bigger that have occurred in the area from1980 to now. The different colors indicate different depths. Purple means the earthquake occurred between 21 and 36 km depth (~13-23mi), red is very shallow (near the surface) and orange (1-5 km), yellow (5-11 km), and blue (11-21 km) are inbetween. I chose not to show earthquakes smaller than magnitude 2, because we may not have been able to detect all of them with our network. I would not be able to make any statements about the number of earthquakes increasing or decreasing over time. However, we should have been able to detect all, or at least most, magnitude 2 or larger earthquakes in this region, even back in the nineteen eighties.
In the figure below, I am plotting the cumulative number of earthquakes in the blue shaded box from the first figure.

Prior to 1997, there really hadn’t been very many earthquakes in this area (disclaimer: we don’t know about the era before ~1969 which is when our network started recording earthquakes). It appears that the M4.9 earthquake, which occurred at around 13 km depth (8 mi) or shallower, perturbed the stress field in the surrounding crust. The aftershocks tended to be shallow. Other events in the area tend to cluster around 25 km (16mi). This next figure shows the depth of earthquakes as a function of time in the blue shaded area between 1980 and now. It is easy to recognize the 1997 main shock and its aftershock, because they are shallower than the background seismicity. The 2017 swarm, and the apparent increased seismicity rate since then (more earthquakes per unit of time) are also easy to see.

So, what does it all mean? Should people in Bremerton be scared? No! But they, and everyone else in WA and OR should always be prepared for bigger earthquakes, see for example https://crew.org/what-you-can-do/.
It is still difficult to draw any firm conclusions regarding the relationship of this seismicity to the Seattle Fault Zone because we don't know how accurate the calculated depths of small earthquakes are. So, to finish, I am just going to post the same journal article figure from Johnson et al. (2004) that compares four different interpretations of the seismicity (and velocity profiles) in this region (grey circle shows the location of the 2017 swarm, and also of the recent seismicity):

(a) Schematic map and (b, c, d, e, and f) cross sections along lines A-A′, B-B′, and C-C′ showing different structural interpretations for the central Puget Lowland and seismicity. Hypocenters are from the Pacific Northwest seismic network for the years 1970–2001 and have magnitude ≥2 and depth uncertainty of up to ∼4 km. Swaths of hypocenters projected onto cross-section lines are 25 km wide. BI, Bainbridge Island; Br, Bremerton; EPZ, East Passage zone; PS, Puget Sound; RM, Rosedale monocline; S, Seattle; SFZ, Seattle fault zone; T, Tacoma, TF, Tacoma fault; VI, Vashon Island. (From Johnson et al., Tectonophysics, 2004,
To entice further comparisons, I will show what the depth profile looks like, i.e. the earthquake hypocenters in the shaded blue area on the first figure have been projected onto a line that goes from A (SW) to B (NE). Have fun and a Happy Holiday!
