Seismic monitoring of a slow landslide
Update available on Jan 3, 2018
Update available on Jan 4, 2018 (preliminary interpretations)
Update available on Jan 7, 2018 (some confirmation and additional thoughts)
Update available on Jan 11, 2018 (Some additional analysis)
Update available on Jan 14, 2018 (analysis of highway traffic)
Update available on Jan 20, 2018 (Some ground truth)
Update available on Jan 24, 2018 (2 new stations and early analysis)
Update available on Jan 31, 2018 (REDPy, tentative locations and count analysis)
New blog on the Continued Landslide Monitoring in February, 2018
Original post of Dec 30, 2017
On Dec 26 the PNSN got e-mail from three different people about an active landslide near Union Gap just south of Yakima. Geotechnical consultants retained by a quarry operation, the local irrigation district and the Yakama Nation each asked us about possible seismic activity that might be related to the landslide. Unfortunately, our nearest station to this site, YA2, has had problems for some time and thus its data are of no use currently. That is, we see no seismic evidence of the landslide motion on any seismic station. Our next nearest station is 14 km away, probably too far to pickup the slight vibrations being generated by slow landslide motion.
Because of reports that the landslide has increased its motion in the past several weeks and the potential for much larger motions the PNSN is mobilizing to install portable instruments near the site. On Tuesday, Jan 2, 2018, three six-channel stations (3-component broad-band and 3-component strong-motion) will be installed within 1 km of the landslide. We are coordinating our installation with a broad-band station to be installed about 2 km from the site by the State Geological Survey of the State Department of Natural Resources (DNR). Seismic data will be made available to all interested parties through the PNSN web site. Special analysis techniques are being developed to help monitor any seismic signals generated by the landslide.
For some details of the landslide check out the news report:
on Oct 29 in the Yakima Herald.
on Dec 22 in the Yakima Herald.
on Dec 22 by KIMA-TV.
on Dec 29 in the Yakima Herald.
on Jan 3 KING-TV has drone images of the cracks.
on Jan 5 Seattle Times article.
on Jan 6 Seattle Times extensive article.
Additional information about our monitoring will be posted here as it becomes available.
On Jan 2, 2018, a crew from the PNSN installed three temporary seismic stations near the active landslide at Union Gap, just south of Yakima. Data from these stations are being telemetered to the PNSN and will be made available in raw form to specialists in landslide seismology. Filtered and decimated seismograms, spectrograms and Realtime Seismic Amplitude Monitor (RSAM) plots are being made available to anyone via the web.
Some care must be taken in interpreting these summary data. Below is a map showing the rough location of the three stations. UGAP1 is located north-northwest of the slide area but near where possible rockfalls onto Thorp Road could take place (but out of harms way). UGAP3 is located just east of the top of the slide area and UGAP2 is located east of the mid point of the slide area. (NOTE: Previous map had UGAP2 and UGAP3 reversed by mistake.) The green polygon is a very rough approximation of where the slide is occurring with slow motion almost directly to the south. Station YA2 located ~ 4 km east was repaired on Jan 3. Station MOX is a permanent, multichannel station off the map. Station DNR is the approximate location of a station installed by the State Department of Natural Resources with local recording and telemetering to Olympia. We are working on combining all seismic traces into one database.
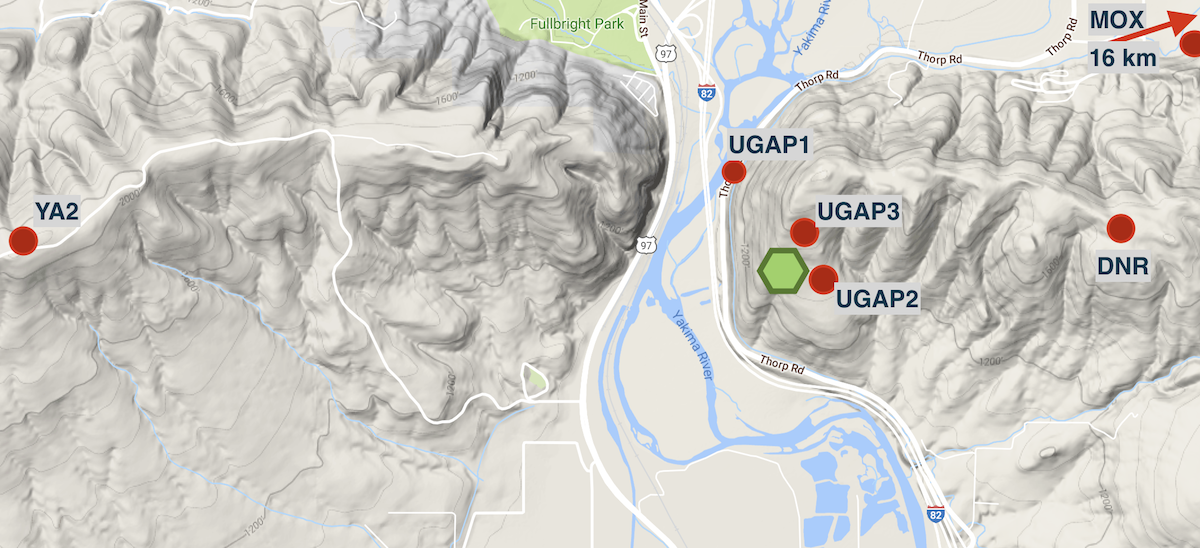
One should note that UGAP1 is a broad-band instrument (HHZ) in which the trace has been filtered and decimated for plotting. UGAP2 and UGAP3 are short-period (EHZ) instruments with minimal filtering. Seismograms of these stations plus two other permanent stations, MOX and YA2, can be found at the URL: http://tunk.ess.washington.edu/UGAP/ MOX is a broad-band station about 16 km to the east-northeast, and YA2 is a short-period station located about 4 km west. It was non-functioning until the afternoon of Jan 3 when a special effort by PNSN staff was made to repair it. Small, high-frequency blips or pops on the traces very likely represent very small jerky motion of a part of the slide or could represent rockfall. We will be studying these data over the coming days to obtain a more specific interpretation.
Spectrograms are much more difficult to interpret than the basic seismograms. See What is a Spectrogram for some help in their interpretation.
We also are running an experimental RSAM system that runs every hour to give a summary of the average seismic amplitude in each 30 seconds of the day so far. Should an extended period of accelerated landslide motion take place this plot should clearly show that. This plot starts over every day. The web page does not allow for viewing older versions, but they are being kept for our internal use.
NOTE: All time on our plots are in GMT (Z) not local time, thus they are PST + 8 hours.
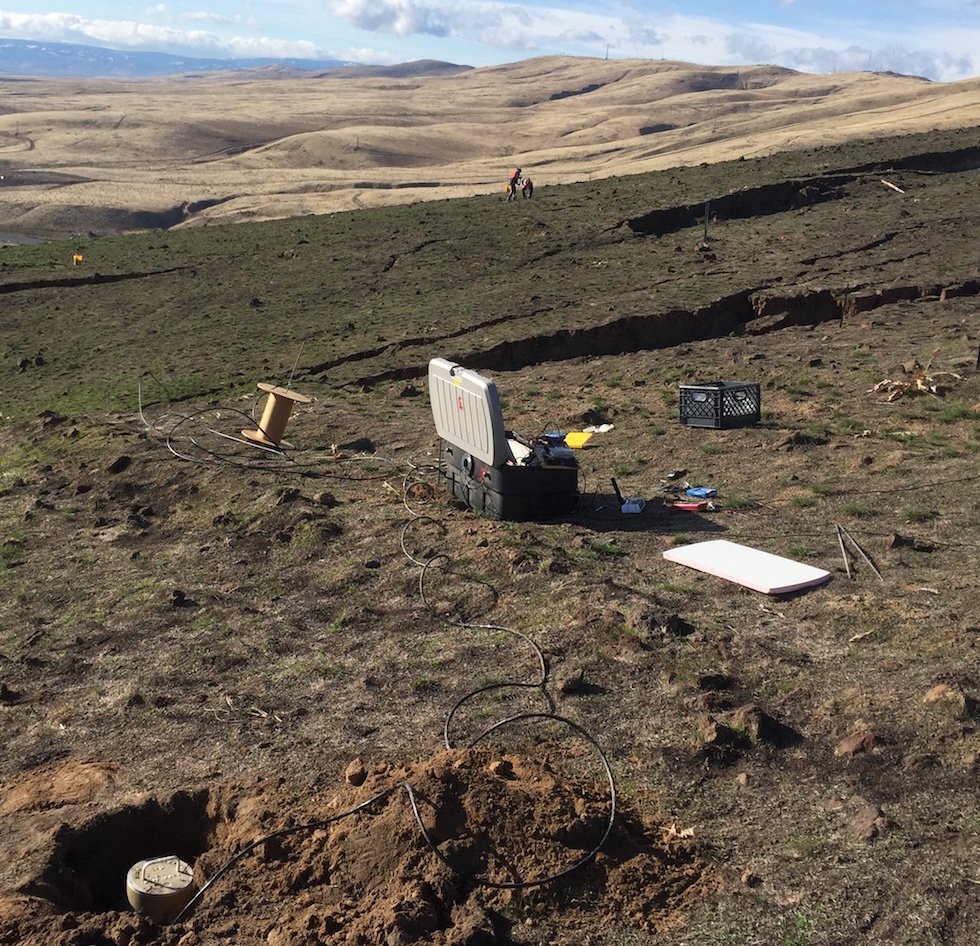
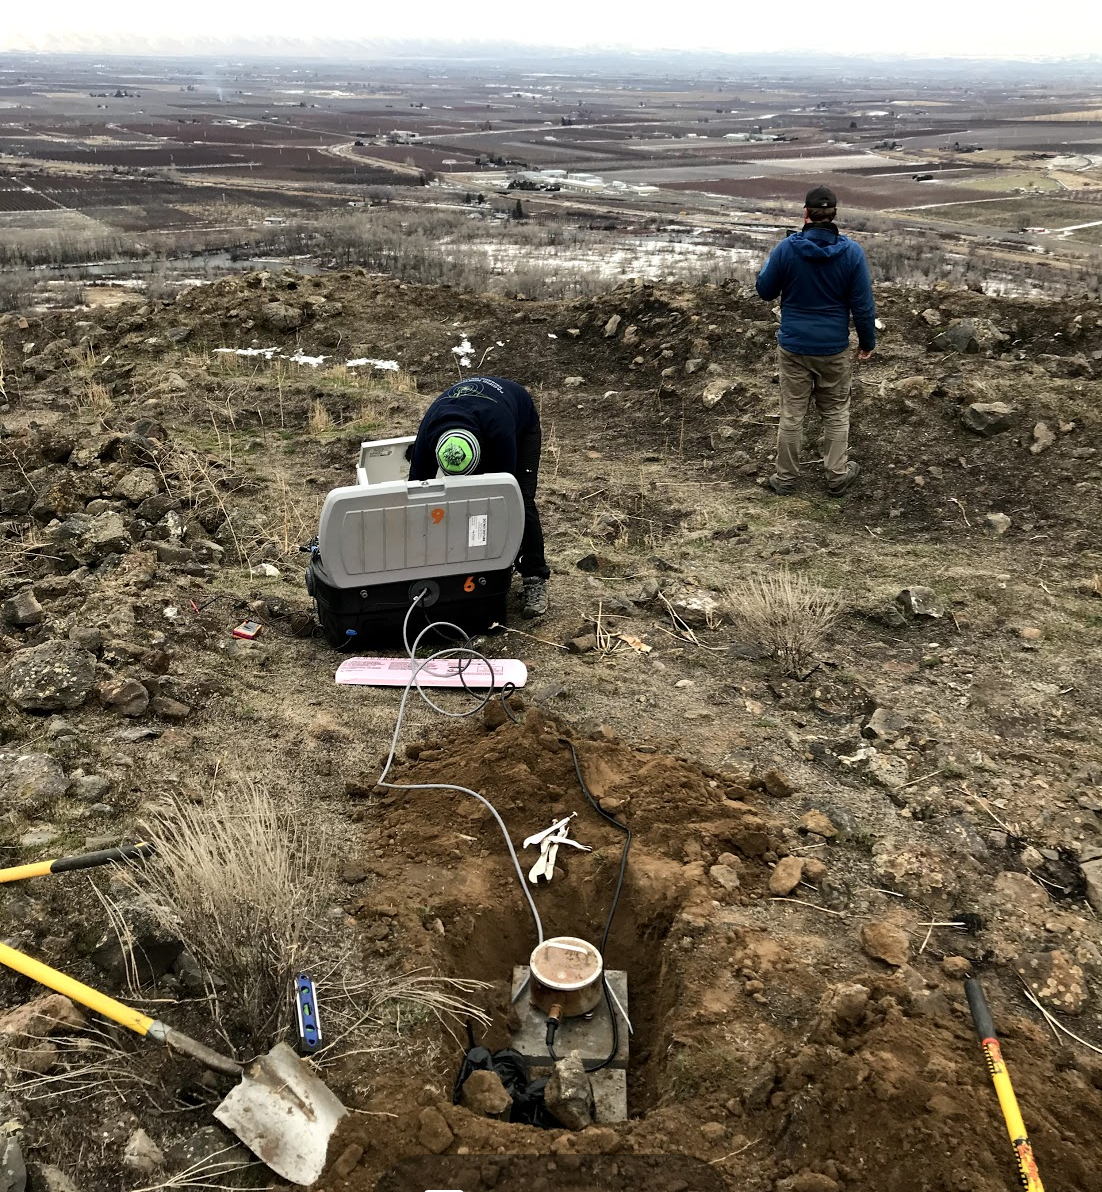
Kudos and thanks to PNSN staff, Jon Connolly, Kyla Marczewski, Doug Gibbons and Karl Hagel who broke away from their holiday breaks to get ready for field work and then spent long hours in the field installing and repairing equipment. Here is a photo of one of the stations as it was installed.
Update on Jan 4, 2018 - Some preliminary interpretations
After a couple of days getting data we now have examples of several types of seismic events that we can try to interpret. Here is an example of a part of the Webicorder plot for ealier today (Jan 4). I have indicated a few of the types of things we see on this (and other records). I follow this figure with detail blowup seismograms and spectrograms of the marked events.

One of the most obvious signals that shows up on all stations other than MOX, are trains. Rail lines go through Union Gap on the other side of the river, and trains on these tracks can shake the ground hard enough to be recorded up to several kilometers (km) away. Such signals typically last for several minutes, first increasing in amplitude and then decreasing as the train leaves the area. Similar to train signals are those from trucks or heavy vehicles on the nearby Interstate Highway. In particular UGAP1 records this traffic very well, since it is located only about 100 meters from the freeway. Of more interest to us are the tiny little blips indicated as "High-frequency" near either UGAP2 or UGAP3. These two stations are located just east of the edge of the active landslide and so are very close to possible landslide related seismic sources. We speculate that, based on their short durations and impulsive first arrivals, they are either due to brittle slip/cracking or free-fall impacts of individual rocks but not not related to large rockfalls. A signal we don't yet understand is that marked as "Low-frequency". There are not very many such signals. They typically are stongest on the near-landslide station but record at some level on all the stations including YA2 which is 4 km away.
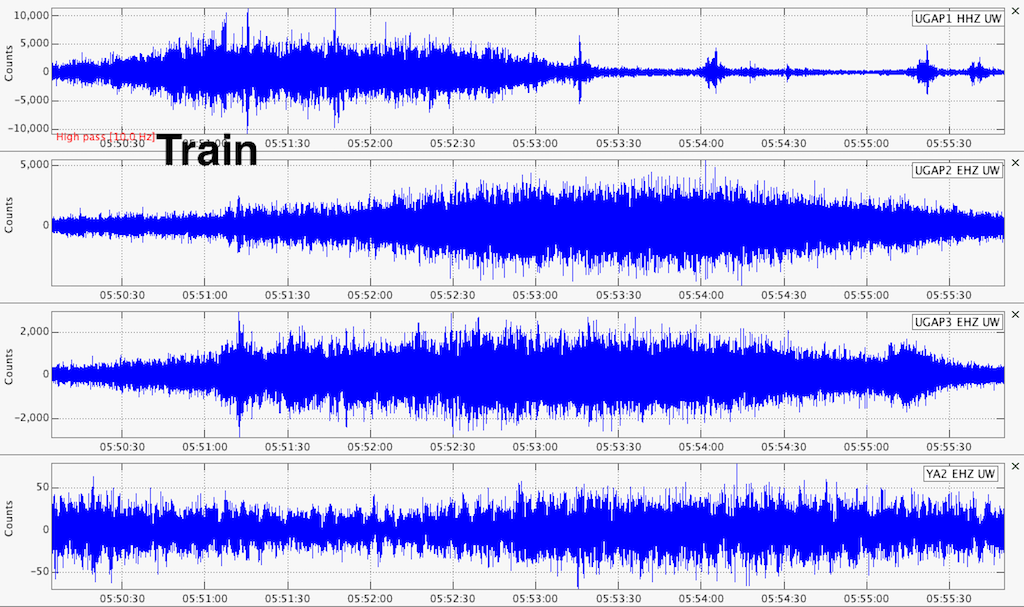
Note that the time scale is different for the train signal; the plot lasts almost 6 minutes while the following examples last only about 10 seconds.
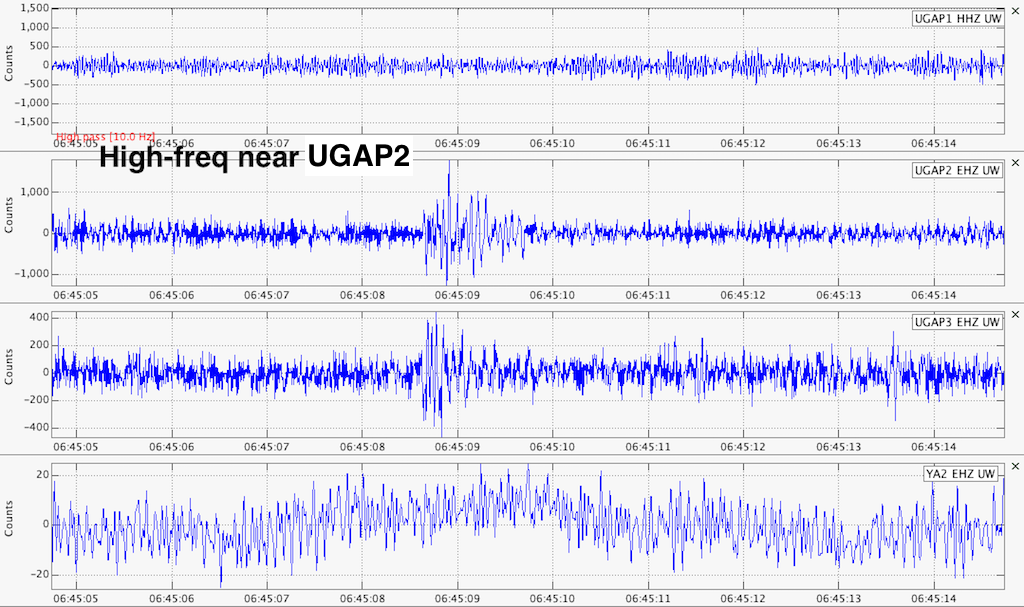
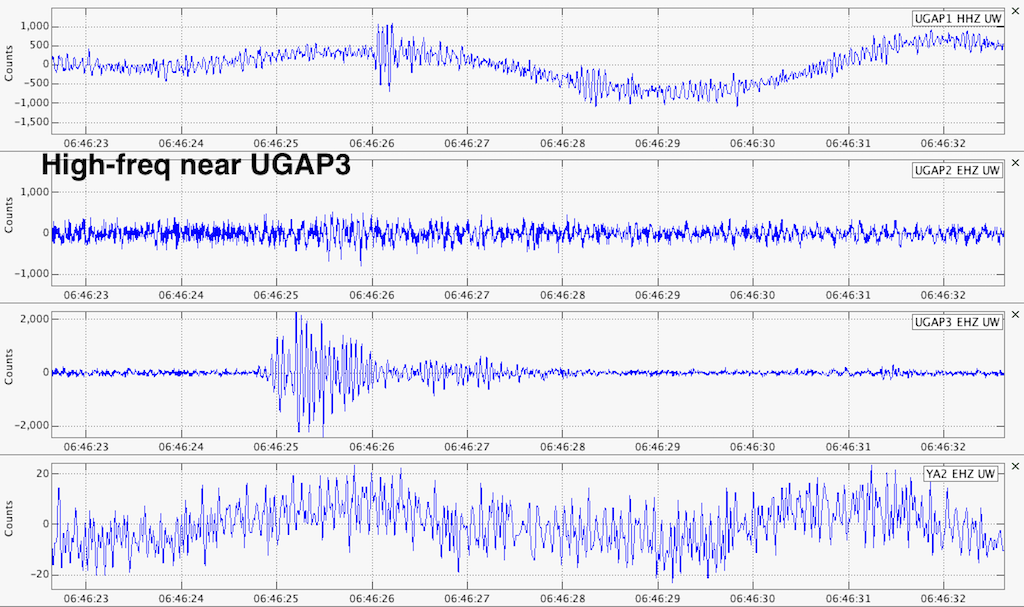
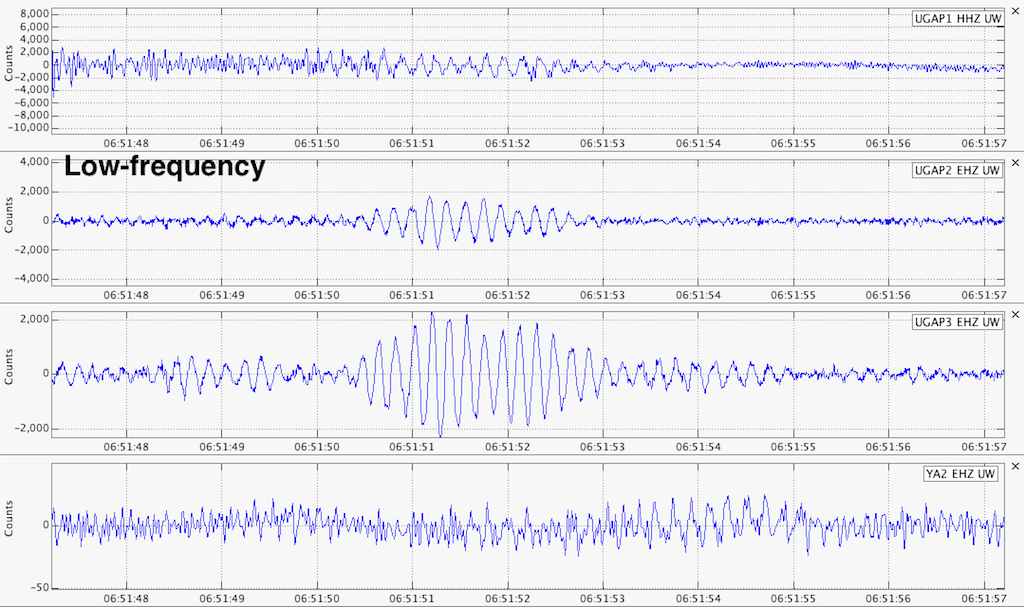
At this point we are not absolutely sure of these interpretations, but, based on lots of experience, we think they are reasonable. We will continue to study these and other signals to see if seismology can help with the interpretation of this landslide and possibly contribute to understanding what it might do in the future.
Update on Jan 7, 2017 (Some confirmation and other analysis)
We now have positive confirmation via local visual observations of the signals we interpret as trains (thanks David) and probable confirmation of the signals we think are helicopters (thanks Mike). We have been concentrating our efforts looking at the high-frequency "pops" that mostly show on UGAP2 and UGAP3, since these stations are close to the ground cracks at the top of the slide and farther from the seismic noise generated by traffic on the Interstate. We are currently working on a detector to help automatically isolate such events, particularly those that seem to be repeating events. So far the only useful results from this is that the low-frequency events mentioned above seem to quiet down at night and thus are likely due to human activity; maybe a certain type of truck traffic. We hope with a few adjustments this will provide yet another way of providing near-realtime analysis.
In the meantime Paul Bodin, the acting PNSN Director and someone with experience looking at seismic data from active landslides, has looked in detail at a few of these events and provides the following observations:
The following are sample detailed seismograms of a some representative events.
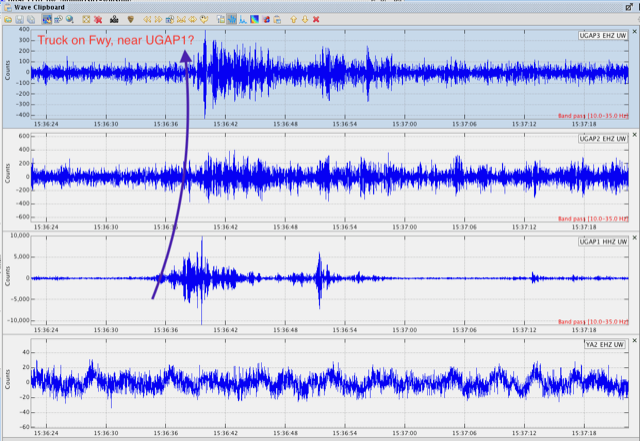
I think trucks (maybe crossing the river bridge?) look like the following where they arrive at UGAP1 first and then near the same time but later on the more southerly stations:
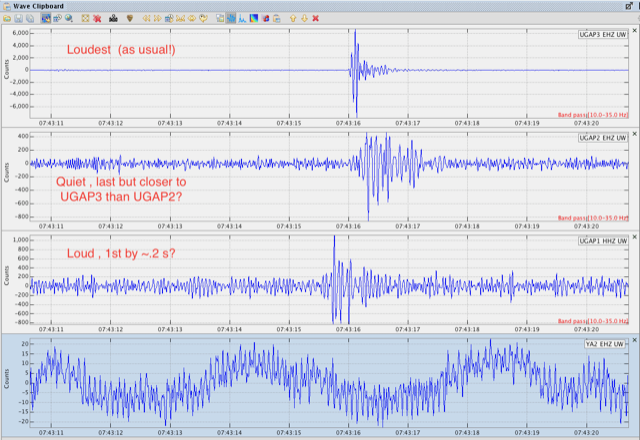
The following is a classic pattern at UGAP3, UGAP2. This partcular one, however, seems to correlate with some sort of shaking near UGAP1:
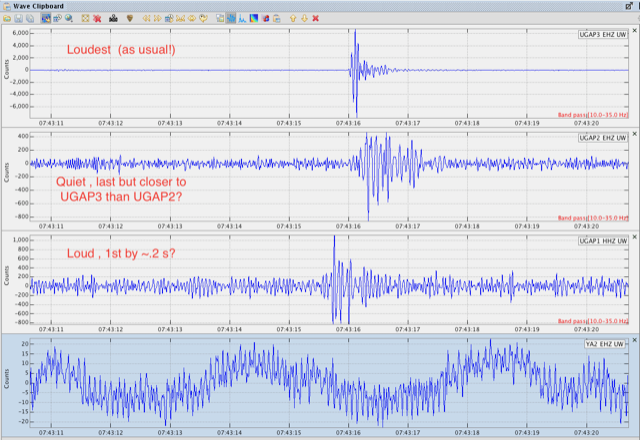
The following plot shows a "pop" that records quite well on all three stations, with UGAP1 being first. Note that the largest amplitude is on UGAP3 (note scale on left axes). Since UGAP1 is a different sort of sensor, and these plots are NOT corrected for sensor type, absolute amplitudes between UGAP1 and the other two stations can not be compared here.
Update on January 11, 2018 (Some additional analysis)
The additional seismic station installed by the State Department of Natural Resources (DNR) on Jan. 2 started telemetering its data to the PNSN on Jan 9. This station, now named UGP4, is located about 1 km northeast of the slide area. It is far enough from the highway and rail lines that the shaking due to these cultural sources in much less than near the slide; however, any signals from the slide are also much smaller. There have only been a few events so far that seem to record on this station that originate at or near the landslide. If events get much larger this will be a critical station in helping to characterize them.
As mentioned before we have been playing with an event-detecting system that can characterize seismic events from within a noisy record that have similar waveforms. This system, called REDPy, was developed by Alicia Hotovec-Ellis, a former UW grad-student who now works for the US Geological Survey. It was originally developed for looking at seismicity associated with volcanoes but has been used in a number of different situations. Because of the the nature of cultural noise on the UGAP stations the parameters for using REDPy on these data have needed to be adjusted quite a bit from their default values. After several different combinations we have a set of parameters that seems to be finding a few clusters of events that are likely associated with slide motion.
REDPy produces a complex set of plots to help seismologists interpret what it is finding. The following figure is part of one of these plots for a single cluster. There is too much here to try to explain all the details, but a few high points are the following: The upper-left panel shows snippets of waveforms around the event that REDPy has identified. The red is a stacked trace of all members of the cluster, and the black is a single, representative trace. The upper-right is an equivalent plot but in the frequency domain. It shows that energy for this event is concentrated around 15 Hz. The lower plot shows the amplitude of each event over time. There are a few periods with high amplitude events (and a period on Jan 9 where the processing was not done).
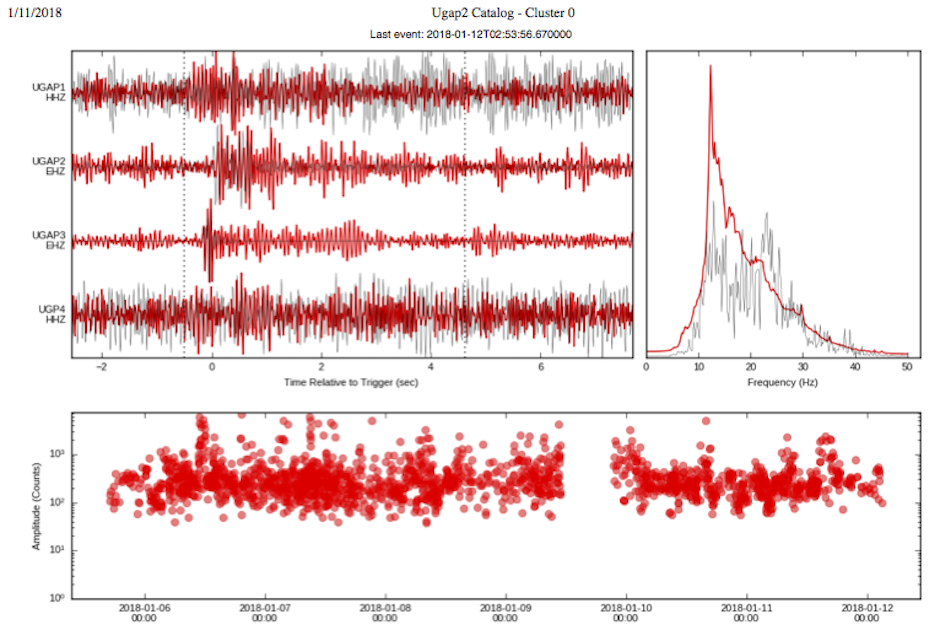
Up to today there have been almost 2,000 of these events. However, there are certainly some false associations in this catalog, because we have set a low threshold for matches. Looking at the number of these events over time there seems to be a decrease. Our interpretation is that either the part of the slide generating these signals has slowed, or the sticky part generating these events is changing character such that the events are no longer matching character with the earlier ones. The geodetic data indicates that the slide is actually slowly accelerating, so the former interpretation cannot be right. In fact, we might expect that sticky parts of the slide interface would change over time. Thus cluster families should come and go.
If the REDPy analysis shows other interesting features or characteristics of the seismic activity they will be reported in a later update to this post.
Update on January 14, 2018 (Seismic signals from hghway traffic and other events)
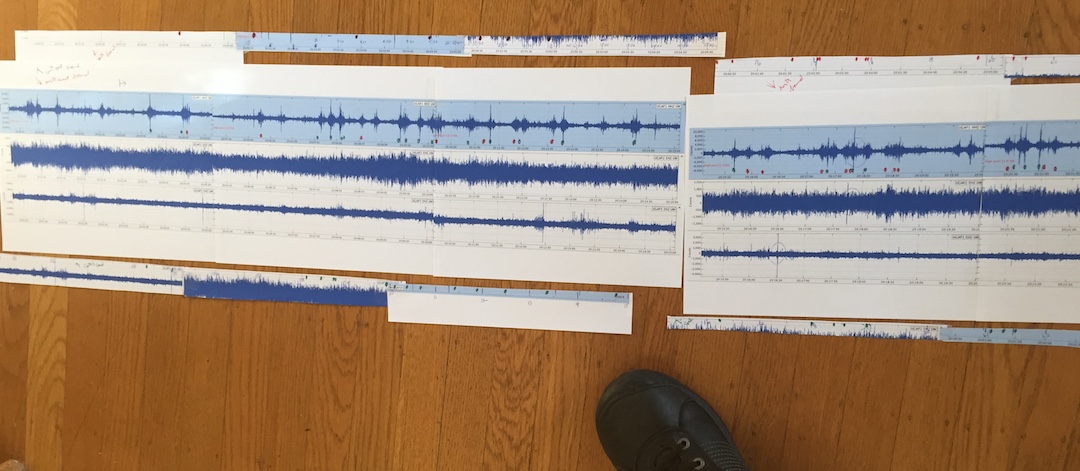
The seismic data from our UGAP stations are much noisier than data from most PNSN stations. The proximity to I82 (Interstate) is creating problems interpreting the data. The quarry operators have kindly provided access to a web-cam that has a partial view of I82. Using this live feed we have noted the times when large trucks pass the field of vew. A complicating factor is that the view is of a section of the highway that is about 1km along the highway from our nearest station, UGAP1 (which is only about 50 m from the highway). Thus, seeing a vehicle go by will either be about 40 seconds before or 40 seconds after it is strongly detected by the seismograph (assuming the trucks are traveling about 100 km/hr (62 miles/hr). To associate seismic signals with vehicles we noted the time and direction of travel for each truck and assumed that only large trucks are responsible for the larger signals. For a half hour period we then ploted up the time of each truck on two sets of graph paper depending on truck direction and at the same time scale as our seismograms. Then, adjusting each graph about plus or minus 40 seconds from the seismogram times, we lined up predicted truck times with signals on the seismograms for UGAP1. Here is a photo of that process.
A plot showing these times on a five minute seismogram for our three stations is shown below. Each station going from north to south shows a vertical component seismogram and a spectrogram of the same signal. The green arrows are at the times of trucks passing UGAP1 traveling to the southeast while red are for those traveling northwest. It is interesting to notice the seismograms look consistently different for the different directions. The sharp, large pulse on UGAP1 for southeast traveling trucks is strange, since the southeast traveling lane is slightly farther from the seismograph (see map near the beginning). We postulate that there is either a road bump or transition going on or off the river bridge in this lane that causes vehicles to excite a large vibration. It looks like this has been picked up by our REDPy system as a a repeating event. Our most common cluster (> 2,000 in the first week) has this pattern. Thus, this common cluster is NOT from the slide, but it too is traffic related.
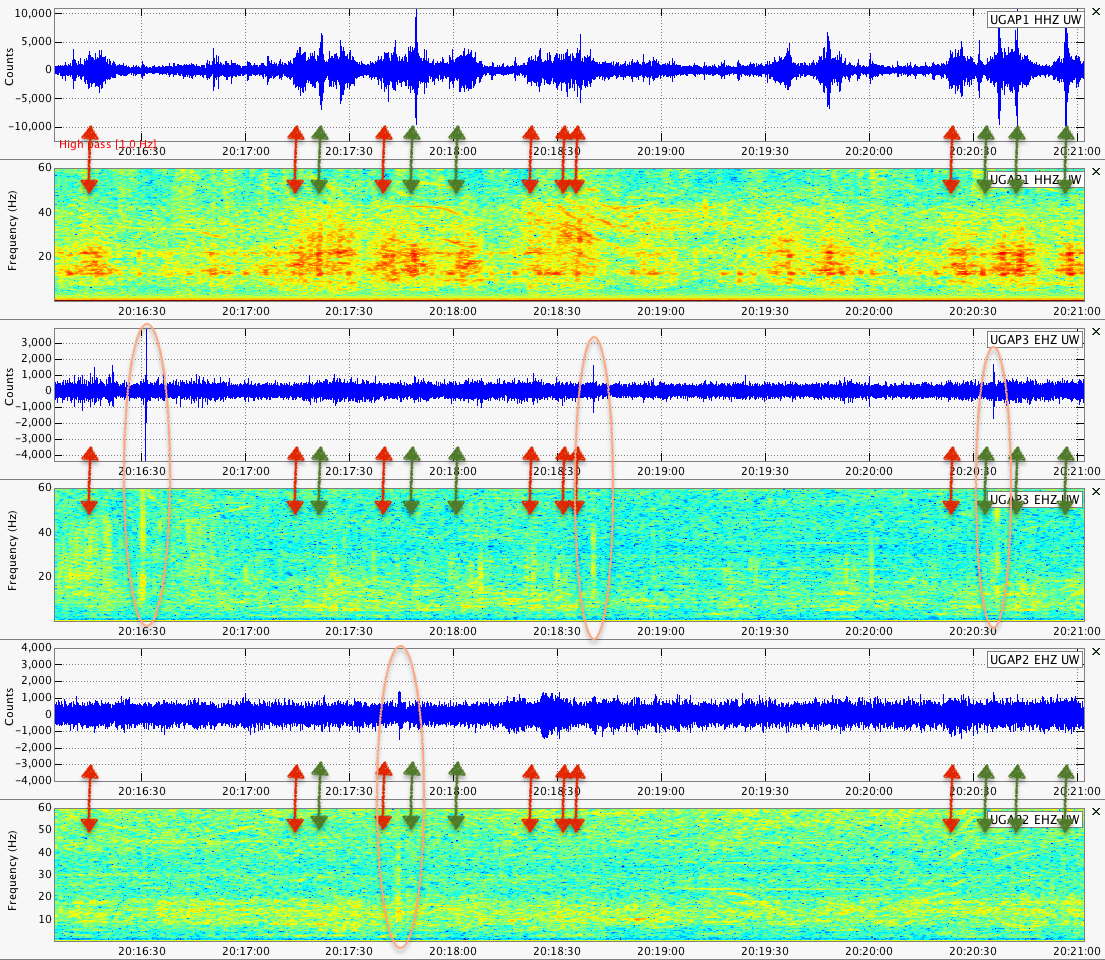
On the above figure there are orange ellipses marking very short sharp events on UGAP3 and UGAP2. Note, they are most obvious in the spectrograms showing that ithey are very broad-band from 10-60 Hz. These are events that are clearly coming from very close to each station, probably from the landslide. Below is a closeup example of one of these.
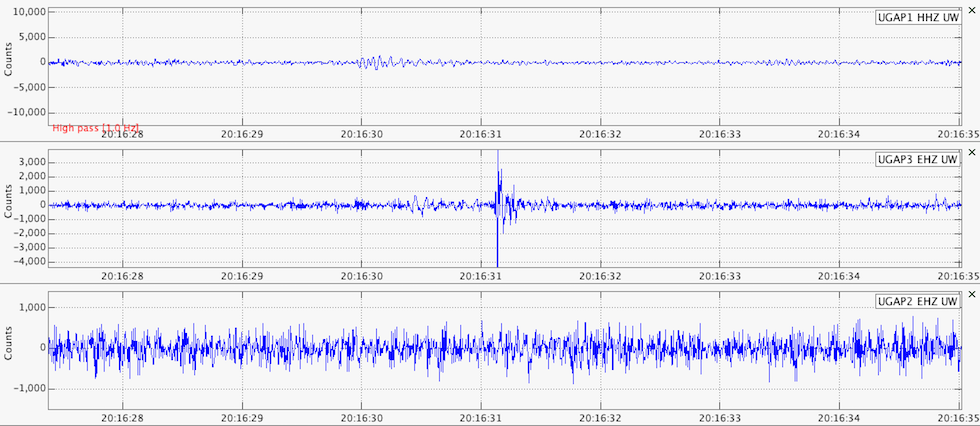
Events similar to this are picked up by the REDPy system, but they are relatively rare.
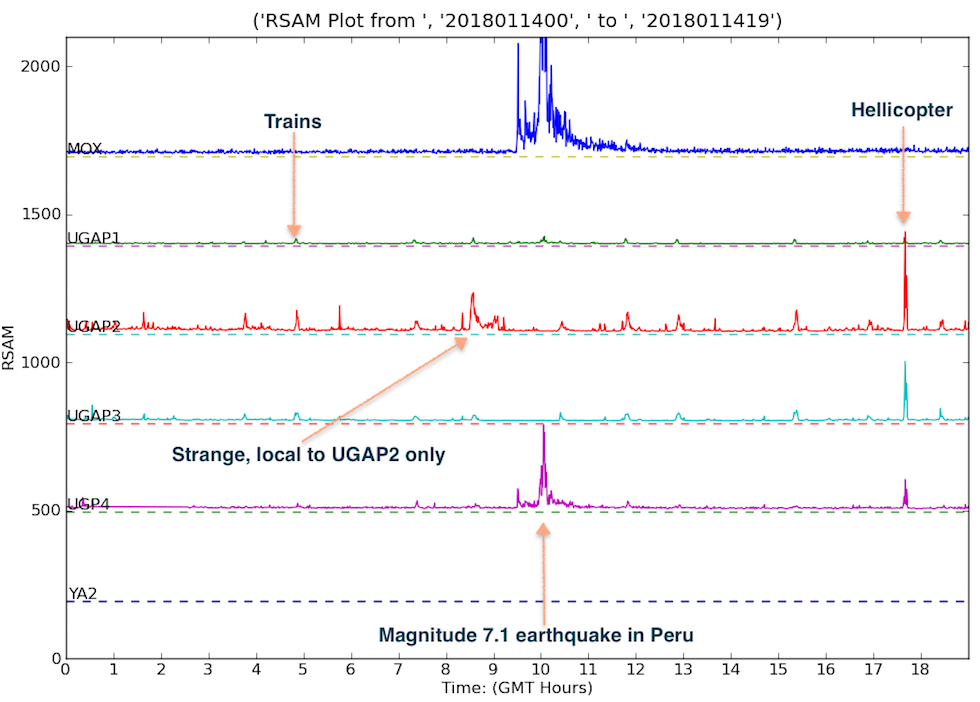
The seismograms and analysis for the past day have been more interesting than some days. Below is the Realtime Seismic Amplitude Monitor (RSAM) plot for the past 18 hours. Besides a Magnitude 7.1 teleseism from Peru (which most strongly shows on the two broad-band stations, UGAP1 and UGP4), there are other local "events". Note the hellicopter signal just before 18:00Z (noon local time). It must be flying over the landslide; maybe a news chopper getting video for tonight's broadcast. The regular blips, one of which is marked "trains", are very easy to recognize on any seismogram. There was a strange set of signals that showed up only on UGAP2 from 08:30Z to 09:15Z (just after midnight local time). At first we thought these must be cultural, but in the middle of the night?? It could be an animal "messing" around the station, but these signals look different from any similar signals we see at other stations that are interpreted to be animal related. We think they may be related to something in the landslide near this station.
There are enough questions about interpretations of the various signals we see, particularly those from last night, that we are hoping to install yet another seismic station, this time with the sensor actually on the moving part of the landslide. Stay tuned.
Update on January 20, 2018 (observed rockfalls provide ground truth)
Seismologists normally study the seismic waves from earthquakes. However, there is a field of exotic seismology that includes studying things other than earthquakes that shake the ground. Mundane sources such as the vibrations generated by humans (people or animals walking near an instrument), nearby trucks or cars or trains and even aircraft (sound vibrations in the air can sometimes couple into the ground and be recorded) are usually of little interest and are considered "noise" that can hide signals of interest. Our stations at the Union Gap landslide have plenty of these sorts of signals, though one is not always absolutely sure what generates a certain pattern. In the previous update we gave examples of how truck traffic on the nearby interstate shows up.
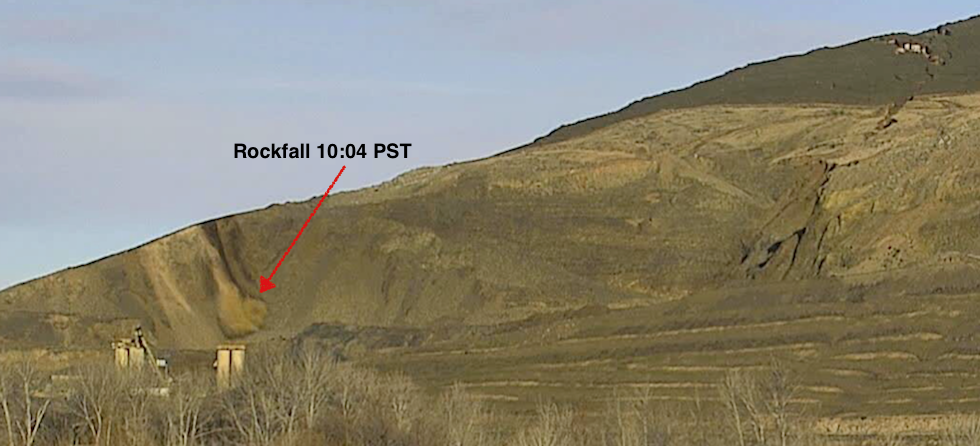
What we are particularly interested in are signals that are related to the landslide. We finally have some ground truth for such a signal. A group from the University of Oregon installed a timelapse camera with a view of the part of the landslide including the part that enters the quarry. They alerted us to a rockfall that showed on their camera yesterday. The following photo taken at 10:04 AM PST on Jan 19 shows a rockfall that may have been some 10s of cubic meters in volume and fell some 10s of meters down a steep slope.
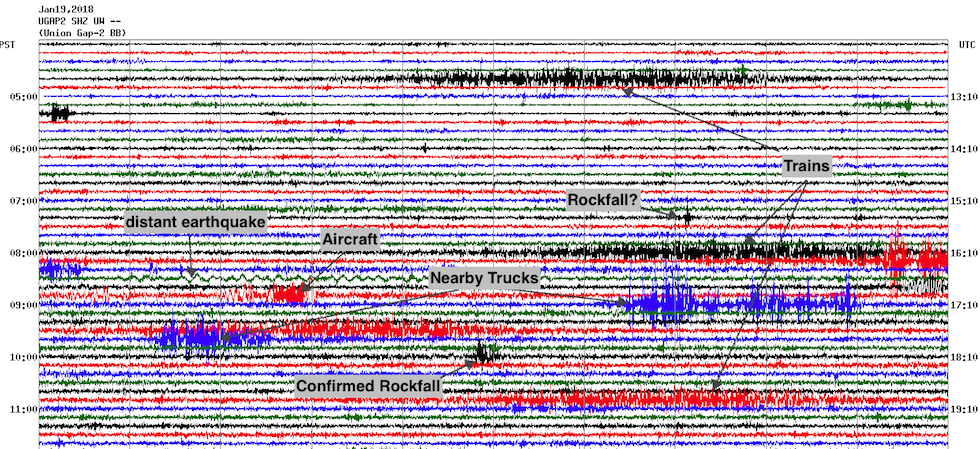
Since we had the time determined very accurately we could match it with a signal on our seismograms. Below is a section of our public Webicorders of a time period around this event. Note that there is LOTS of other activity. We know the sources of many of the signals on this record from other observations, but now we have a confirmed rockfall signal (lower sections of the record).
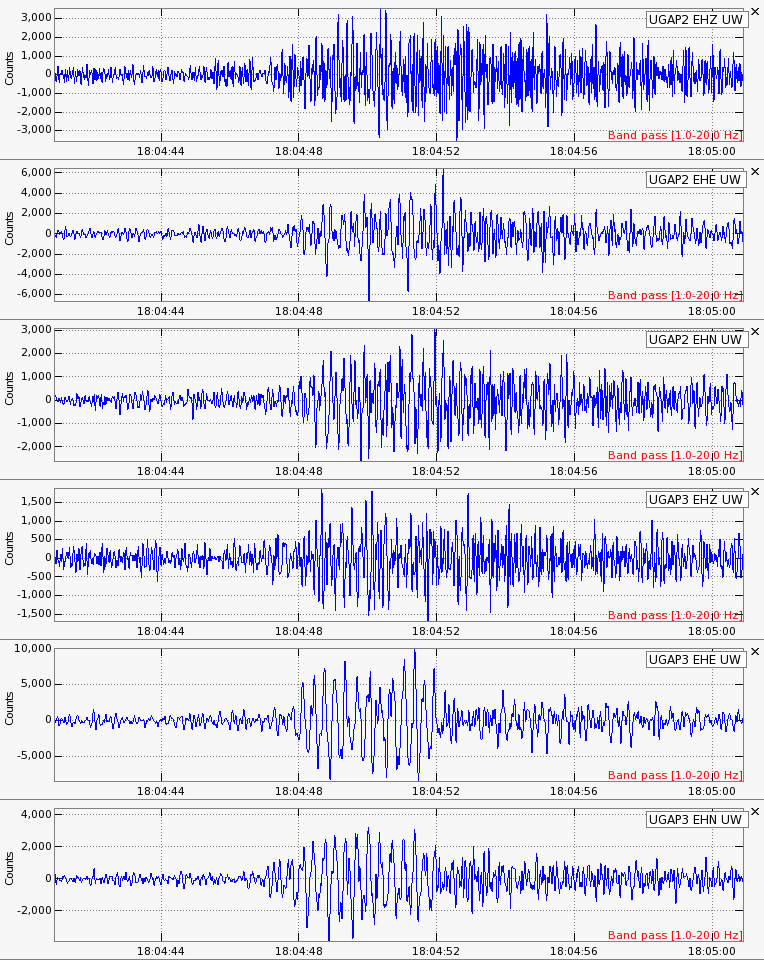
In the following figures we show the detailed seismograms from the less noisy nearby stations, UGAP2 and UGAP3. These are three-component instruments, so there is a trace for the vertical (EHZ), the east-west (EHE) and the north-south (EHN) component for each stations. These signals do NOT look like the ones from an earthquake but do have characteristics typical of a rockfall.
Scanning detailed seismograms such as these to look for other rockfalls would be very time consuming, thus we are using a different way to look at the data to help to quickly find such events. The following figure shows ten minute spectrograms around this same signal. Looking at these sorts of plots the rockfall signal shows very nicely on two of the stations. Of course, UGAP 1 has so much cultural "noise" from vehicles on the nearby interstate that it doesn't have a diagnostic rockfall signal.
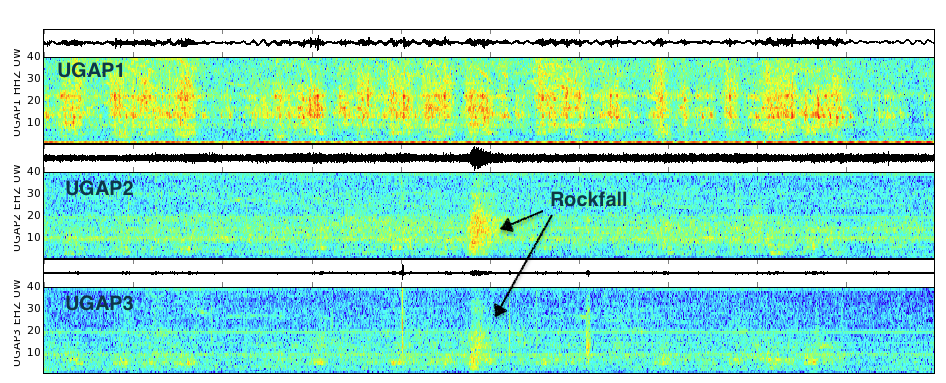
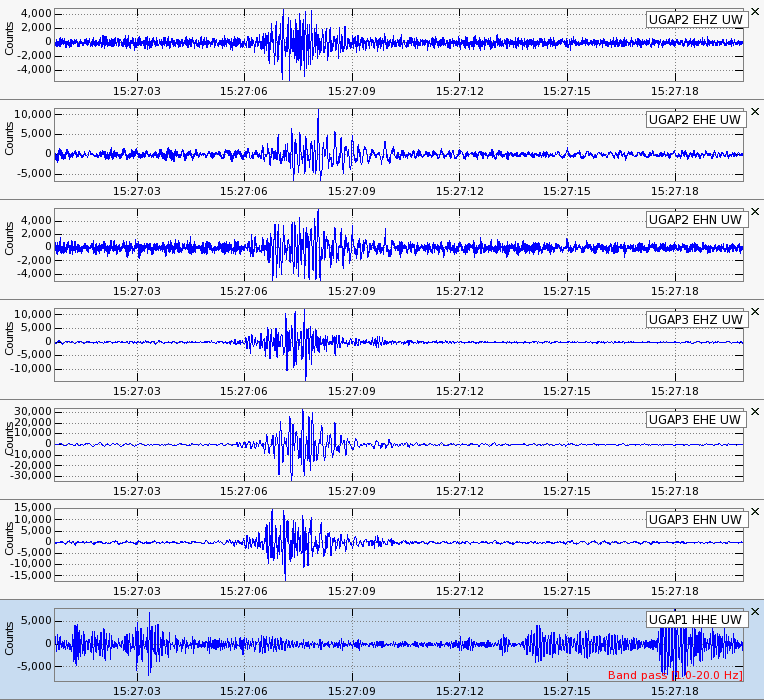
Using this rockfall as "ground truth" for what their signals might look like on spectrograms we have scanned more of the past few days and found one additional event that looks similar. However, for this event there is nothing on the timelapse camera that corresponds to that event's time. It also has some characteristics that give the impression that it is closer to the stations, maybe in the upper part of the slide block where the camera can't see. This event is marked on the above Webicorder as "Rockfall?" because it could not be confirmed with ground truth. Below are the detailed seismograms for this event. Note that it has a shorter duration and higher frequency content. We think this (and other aspects of it) means that it is located closer to the stations and has a much shorter fall.
We will continue to look for these and other unusual or exotic events and hope that some of them can be confirmed with ground truth. Within a few days there may be additional seismic data from stations very close to and on the slide block. This should greatly help our interpretation of strange and exotic signals.
Update on January 24, 2018 (2 new stations and preliminary analysis)
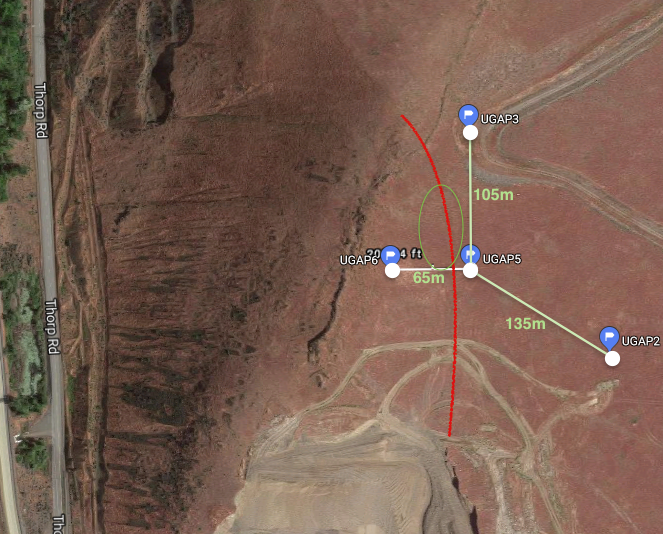
On January 22 a PNSN team installed two new stations at the landslide site, one on the slide block and one just off of it to the east. Here is a photo taken from near station, UGAP5 (sensor is in the lower left) looking west to where two team members are installing another sensor on a cable from the datalogger (in the open utility box) for UGAP6 65 meters away. The scarp bordering the landslide is located about 10 meters beyond the datalogger box. Because the landslide is moving and could possibly move much faster than its current ~7 cm/day (~3 in/day) we were concerned about doing a cable installation. Our solution was to se a "break-away" connector near the datalogger with that end of the cable firmly attached to the ground. We have left about 10 meters of slack in the cable to accomodate significant motion without it pulling loose. But, if the 10 meters is exceeded then the cable (and sensor) will disconnect without pulling the more valuable datalogger and elecronics over the edge.
With these two new stations we now have a nice four-station array with an aperture of about 1 km. The following map shows these stations in relationship to the approximate location of the nearby landslide scarp. In the two days since the new stations were added many very small events have been recorded. We have not yet done detailed analyses of these events, so we don't have quantitative locations yet. However, by waveform amplitude and timing, we can infer that many of these events are located roughly within the green oblong on this map.
Below is a figure showing seismograms from a typical event. It shows two components of four stations (and one from UGAP1). Many of these events have strong first arrivals at station UGAP5 and the latest and weakest signals at UGAP2 and don't record at all on UGAP1 300+ meters to the north-west.
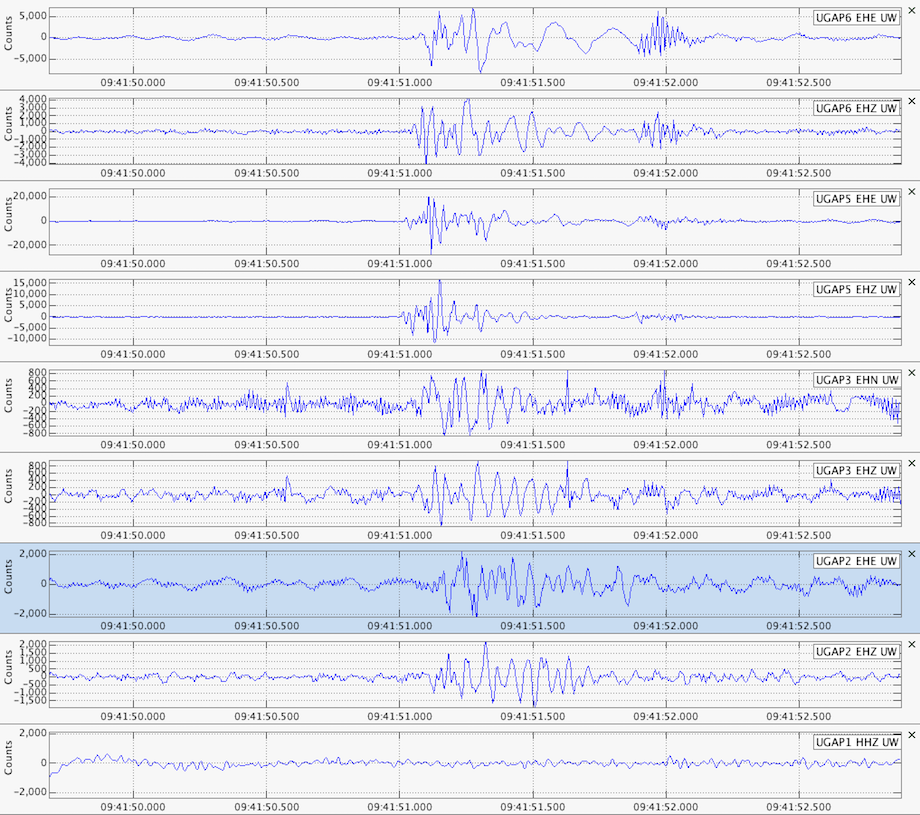
Few events seem to be coming from the southern part of the slide block down near the quarry or from west of station, UGAP6. Our early interpretation of these data are that most of the tiny earthquakes we record are related to the upper part of the slide, perhaps around its edges where it is pulling away from rocks that are stable. If this early interpretation holds for more events when more rigorous location routines are applied, it has implications for understanding the nature of the sliding surface under the slide block.
We are currently modifying the parameters for our REDPy cluster analysis process to help examine more quantitatively the hundreds of tiny events we are now recording on four stations. A report on this process and other analysis will be forthcoming.
Update on January 31, 2017 - REDPy, tentative event locations and Size Analyses
As we know from previous analyses (covered in several previous posts to this set of observations) there is a lot of cultural "noise" on the UGAP stations. Finding the signals for small events can be tricky in the presence of this noise. When events of interest have similar waveforms, which means they are located in similar places with the same motion at the source, we can automatically find these events with REDPy. REDPy's initial detection of an event, to look for matches, is highly dependent on the time of day. During daylight hours when there is lots of traffic on the Interstate Highway detection levels go down to about 40-50 events per hour, but at night, during low noise periods, detections can be as high as 150 to 200 per hour. Using configuration parameters specific to this data set (bandpass filter: 16-50 Hz, long-term average: 5 sec, short-term average: 0.4 sec, minimum correlation coefficient: 0.65, number of stations correlated: 3) we have now been running it for the past week. While it does find some clusters that we feel are really cultural noise bursts most of the clusters REDPy finds seem to be real events local to the slide block. About a quarter of the detected events can be matched to a cluster of events. Here is a figure showing the rate of detections separated by those that can be matched to a cluster (red) and those that don't seem to match (orphans in gray):

Most of the orphans are probably related to either very small events that only have singals at one or two stations or are more random. During periods with lots of traffic noise fewer of these are detected, but even those that can be associated together into a cluster are impacted by the reduced sensitivity during daylight hours (~15:00 to 02:00 UTC on these plots or 7am - 6pm PST). REDPy has so far found almost 100 different clusters, some with only a few events. Most of the clustered events (>75%) fall into one of about half a dozen clusters. We looked at waveforms for each of these clusters, and by timing the first arriving waves at each station we were able to get rough locations for these events. Here is an example of the waveforms for one of these clusters (Cluster #1 with 740 events):
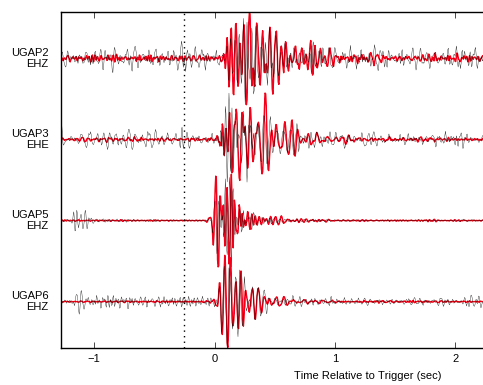
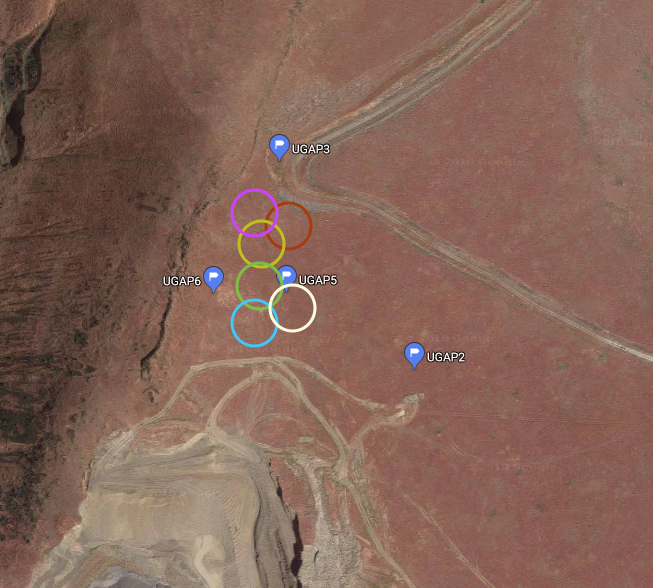
As with most of the detected events, the first arrivals are on UGAP5 and the last on UGAP2. Given the expected velocity for seismic waves in the near surface and figuring that these events must be quite shallow (within 100 meters of the surface) we can get rough locations. The following figure shows the rough locations for the six most common clusters. The size of the circle is a qualitative estimate of the uncertainty of the locations. The green circle is for Cluster #1 (the waveforms are shown above), the one with the most events in its cluster.
The following figure shows the waves for cluster #4 (26 events), which ,on the above map, is the magenta circle. Note that the waves in this case arrive at about the same time on UGAP5, UGAP6 and UGAP3 and much later on UGAP2, the farthest away station.
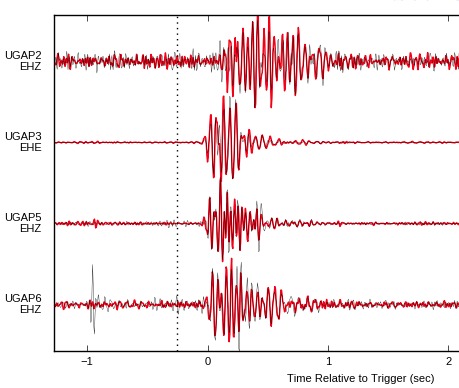
The final example is for the cluster shown in blue on the map (Cluster #10). Its waveforms, shown below, have first arrival times at UGAP5 and UGAP6 at the same time and somewhat later UGAP3 and UGAP2 at the same time. This cluster of 68 events is the farthest south that we have seen. Most of the events we detect fall somewhere between the green and the magenta clusters.
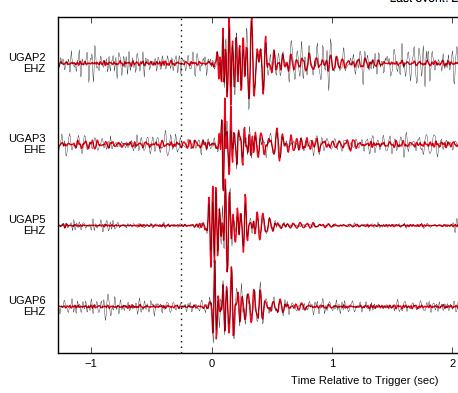
We are now pretty confident that we have the REDPy system configured to give us a good monitoring tool for those very small earthquakes that are associated with the active landslide.
People seem to always want to know what magnitude these are (on the Richter Scale). Because they are so small it is not possible to determine the magnitude in conventional ways, but our estimate, based on some hand waving and scaling laws for earthquakes, is that they are about magnitude = -2. (minus 2). Remember that magnitude is a logrithmic scale, so -2 is 10,000 times smaller in amplitude than a magnitude +2 earthquake, which is smaller than can usually be felt. Again, waving arms and back of the envelope calculations, this comes out to about a 2 meter chunk of rock stick-slipping only about a milimeter. It's not a lot of action considering the whole slide is moving about 7 centimeters a day. We are only seeing the cracking and breaking of bits of fresh rock around the edge, and the slide itself is mostly aseismic.... at least at this time.
By the way, anyone interested in watching the seismic data come in from these stations in realtime (only a few seconds delay) check out our "QuickShake for UGAP" page. You will need to rescale the amplitudes with the slider in the lower right corner to make these signals look normal. Also, remember that this display is highly decimated, so the high-frequency pops of the very local slide related events don't show up as well as they do in the full resolution data we analyse in the lab.
This blog thread will terminate here (it's getting too large and unwieldly for one post), but another will be started in a few days to continue with this interesting story of an active landslide. See the new blog on the Continued Landslide Monitoring in February, 2018.
