Continued Landslide Monitoring
Seismic monitoring of a slow landslide near Union Gap in eastern Washington continues with several new analysis techniques being developed and applied. For details on the PNSN mobilization and initial monitoring procedures see the extensive Observations and updates for the January period. This current post is a continuation of reports on our observations and analyses started on February 11, 2018.
Update on February 15, 2018 (A mystery and forensic seismology) Update on February 27, 2018 (A rockfall and other observations) Update on March 16, 2018 (No change in the slide) Update on March 26, 2018 (A little seismology science)
Update: February 11, 2018 (A review of monitoring and a new monitoring parameter)
Here is a list of products available on the web that, along with other techniques, we routinely use to review the seismic activity related to the landslide:
Raw Webicorders (12 hour-long, 10 minute-trace seismograms)
Spectrograms (time versus frequency)
RSAM (Realtime Seismic Amplitude Monitor)
REDPy (cluster identification over time)
UGAP QuickShake (realtime seismograms)
Tuned event counts (very local, tiny earthquake counts over time. Described below)
Two real-time cameras (several images per minute. Provided by U of Oregon)
We also have access to daily reports from an automatic motion detection system, and we participate in weekly discussions with other organizations monitoring the landslide. Should we notice unusual seismic activity associated with the slide we will immediately notify the monitoring group and participate in discussions regarding interpretations of the situation.
Number 6 above is a new monitoring tool. To help us quickly recognize changes in the number of tiny earthquakes we record we are now using an automatic "tuned event counter". Alex Hutko of our staff, who is a specialist in studying seismic noise and characterizing the quality of seismic data, has developed the system to try to automatically minimize the detections of cultural signals and maximize the detection of landslide related, tiny earthquakes. Using a process of filters and amplitude thresholds this counter runs on all of our seismic stations. The top part of the display shows counts of only events that record on more than one station. Here is an annotated snapshot of part of the display for today. Of course, as time goes on the hourly updated display will change.
There are several things to note on this plot. The numbers along the bottom are day-of-the-year (Julian day). When there are gaps in the data for one station the combination plot at the top will show no data even if the other station has data. Because of a problem in our waveserver there is frequently a short gap at the end of many days giving a drop in the counts (seen on the 10 day plot, not on this example above). Note, in the bottom plot the "power" at a station (not the number of events but the overall signal level in the seismogram) has a very diurnal pattern, due to the the diurnal nature of traffic on the interstate highway.
One thing we are not sure how to interpret is the apparent notable increase in the average number of counts on station UGAP3 and perhaps UGAP6 (though the record is shorter) over the past month. Unfortunately there was a period of time when UGAP3 had electrical problems that looked a little like tiny events to the automatic counting software (day 24 through day 27). However, if one excludes that time period there apears to be an increase in the raw counts over the whole period from about 25 events per hour to around 50 events per hour. This level has stayed steady for the past week or two. Perhaps this averge count level is representative if the speed of the landslide which was slowly increasing up until mid January when it stabilized at about 7.5 cm/day.
Another thing to note is that the count levels on UGAP5 are quite high, UGAP6 a bit less and UGAP3 and UGAP2 less so. The station UGAP5 is located just a few meters from the largest part of the landscape scarp and, based on approximate event locations covered in an earlier post, one might expect that near this station is where most events are taking place. The count numbers are consistent with this.
Update of February 15, 2018 - A Mystery and Forensic Seismology
Whenever seismologists see seismic signals unrelated to earthquakes our interest is piqued. The seismic stations monitoring the Rattlesnake Ridge landslide near Union Gap, WA are filled with non-earthquake signals. Most we know the source for and consider to be "noise" (ie windy periods, trains, trucks, cars, helicopters and other aircraft). Recently we noticed a strange signal that showed up on all of our stations in the area and lasted all night (Feb 12 -13). Here is one view of when it occurred.
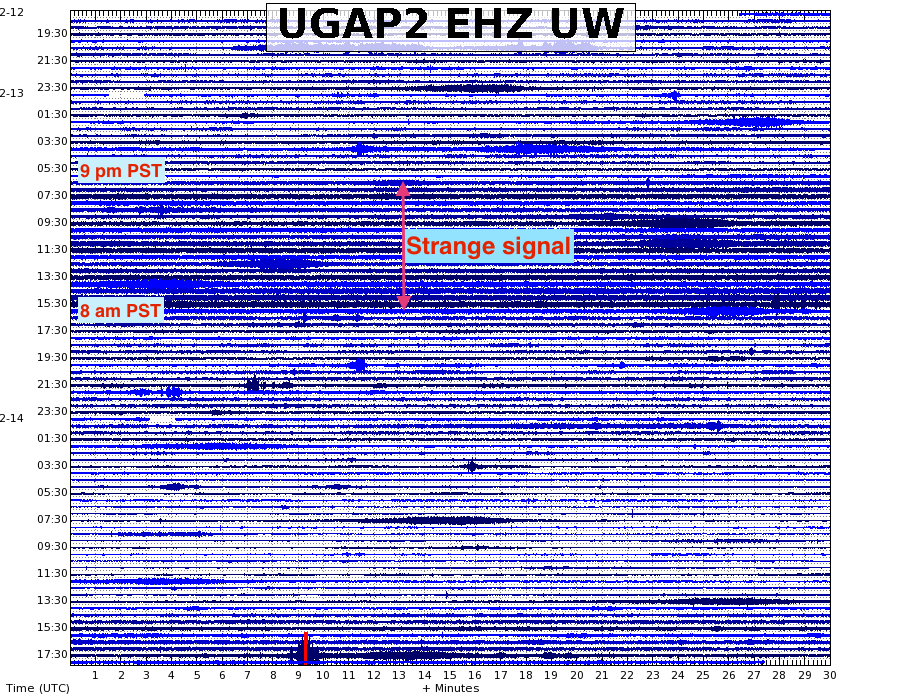
This is a two day helicorder-type seismogram (one line is 30 minutes) for the time around the night of Feb 13. Remember the times along the left edge are in Universal Standard Time (GMT or Z) which is 8 hours ahead of Pacific Standard Time (PST). The approximate period of the strange signal is from 10pm PST on Feb 12 until about 8am PST on Feb. 13. In this very compacted view one can just see that there is something different (larger signals) than at other times. We can easily see that there is this elevated signal level on all stations in the vicinity via the RSAM Plot. What about the character of that signal? If we zoom in to a part of the signal we can look at it in both the time (seismogram) and the frequency (spectrogram and spectra) domains. Here is an example of a couple of minutes at about 3:30 am PST on Feb 13.
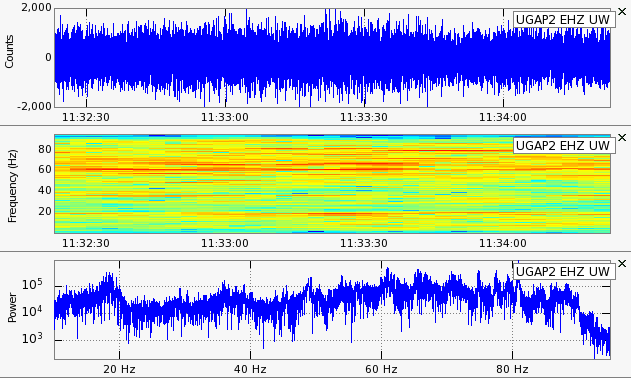
Note in the spectrogram the many redish lines in the frequency range of 60 - 80 Hz. These can be seen as the bumps in the spectral plot at the bottom as well. Also, note the significant peak at about 18 Hz. This is particularly bothersome to our event detection and counting software that filters the data from 15 - 40 HZ. This 18 Hz signal, while it varies a little in strength, is almost always there during this period and records on both our UGAP monitoring stations and stations 1.1 km (UGP4) and 4.2 km (YA2) away. Below are the same sorts of plots for a two minute period almost exactly a day later; early morning of Feb 14.
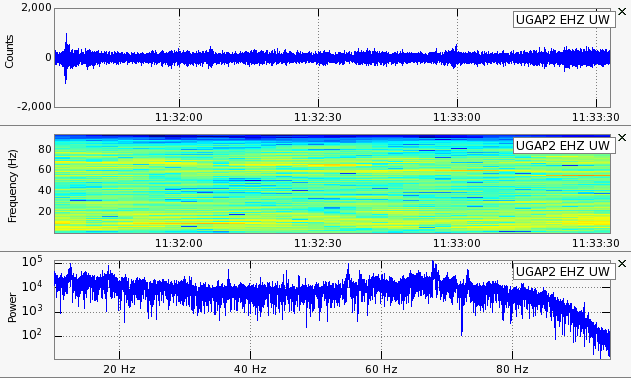
The scale is the same as before. It's obvious that the overall signal levels are much lower, and the many peaks, particularly the one at 18 Hz, are gone. One can also see near the beginning of the seismogram a small event (probably from the landslide) that would have been totally obscured the night before.
So, what is this mystery signal? We have not seen it on other nights. None of the other monitoring techniques have reported anything unusual going on with the landslide, and from years of looking at seismograms we don't think it could have anything related to the landslide. We were very suspicious that it must have an anthropogenic origin. It must be either a very strong source, such as a boring machine or rock crusher, or a bunch of distributed sources. We know of nothing in the area that is big enough or would be operating in the middle of the night for the former. A possibility we thought of was that the people at the Yakima Firing Range were doing some sort of night time manuvers and driving dozens of tanks all over the place all night. Calling them turned up no activity. After sending out queries to some people who live in the area we got a response from Ray Wolverton who lives only a few miles southwest of the landslide. Here is part of the e-mail he sent to us:
I think I might have the answer to the constant mysterious seismic signal in that area. The farmers were running their frost fans in that area-----some of them starting around 8:00 or 9:00 p.m. and continuing until around 8:00 a.m. the next morning. I remember looking out my living room window that morning and seeing at least 30 of those machines operating within a mile or two of the landslide area. Typical size of these machines is 100+ horsepower engine driving an 18-20 foot prop. These machines create the noise and turbulence of a helicopter. When running, these can be heard/felt for considerable distances.
Indeed, we think Ray is correct. Several of these fans going at about the same speed could easily induce vibrations we would pick up several kilometers away. There was still a bit of a question as to why we had not seen this before. Looking at the temperature data from the Yakima airport for the past month or so helped to convince us even further that Ray was right. Here is the plot for February.
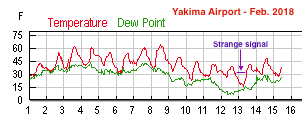
Note that the only time the temperature was significantly below freezing for an extended period was the night of the 13-14th. While January had many cold days, the temperature never went much below 30 degrees F and then only for short periods. In talking with Ray he even predicted that we might see these strange signals again. The forecast is for very cold nights early next week, and so the frost prevention fans are likely to be turned on again. Thanks for your help, Ray.
Update on February 27, 2018 - (A Rockfall and Other Observations)
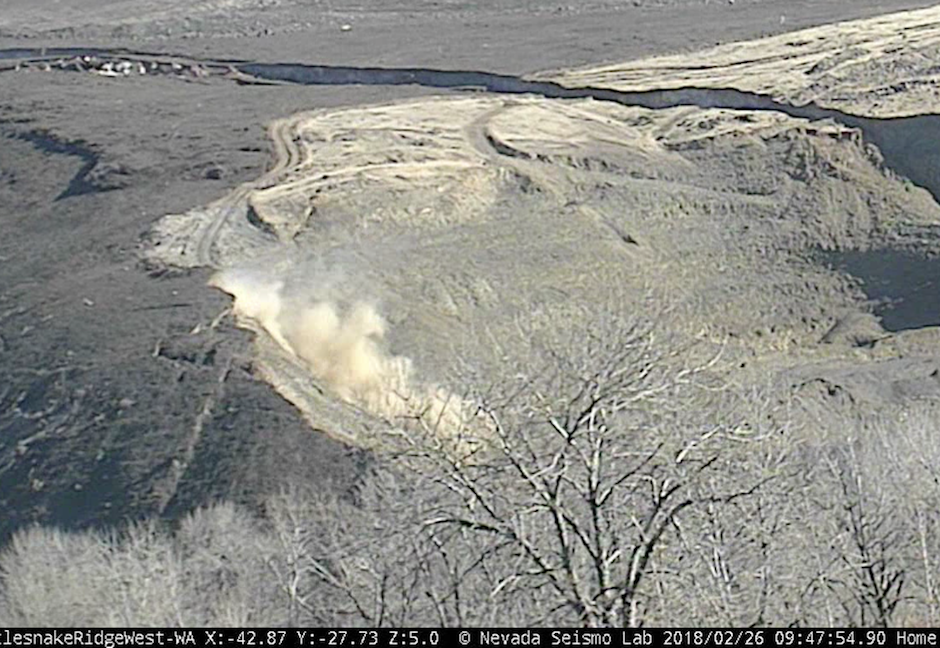
The landslide as reported by the monitoring group continues to still be moving in about the same way as it has for the past month to six weeks, steady at 1.7 feet/week. Yesterday a rockfall into the quarry was reported by the Yakima Valley Office of Emergency Management. It was visible from the cameras watching the incident and from the public driving by the incident site. In reviewing time-lapse camera images it seemed to have taken place at about 9:47 am PDT. Here is an image from one of the cameras taken shortly after the rockfall started. Note the dust cloud rising from the edge of the pit, and note the time-stamp of this photo in the bottom right corner.
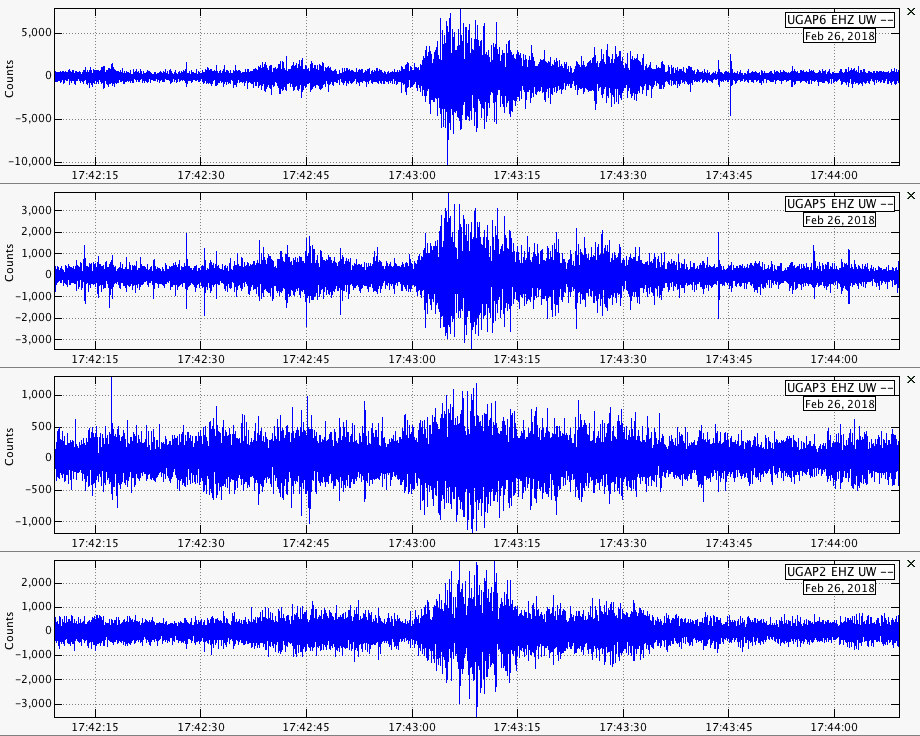
Reviewing the seismograms we find a distictive rockfall signal starting at 9:43 am PST (17:43 Z) with a possible small precursory event about 15 seconds earlier and nothing at 17:47 Z. Checking with the camera operators they confirm that the time-stamping clock for the cameras was not synced to realtime, and the several minutes' difference was due to this discrepancy. Here is a two minute segments of the seismograms from the four monitoring stations on or very near the slide block. Note that the classical cigar-shaped envelope for the rockfall lasts about 35 seconds with two parts. This event appears to be very similar, perhaps a little bit larger, to the rockfall of January 19, 2018 from about the same place.
Yesterday's event did last longer than the January one and had several very small follow-on falls over the next hour or so. If we look at the same records in the frequency domain via spectrograms we again see the characteristics of a rockfall.
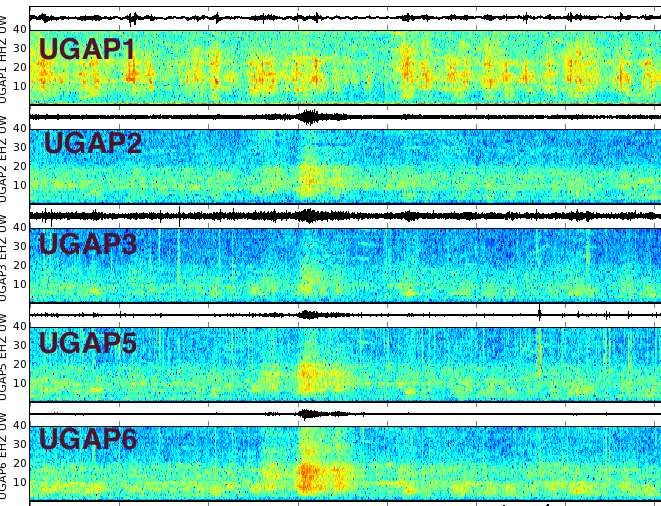
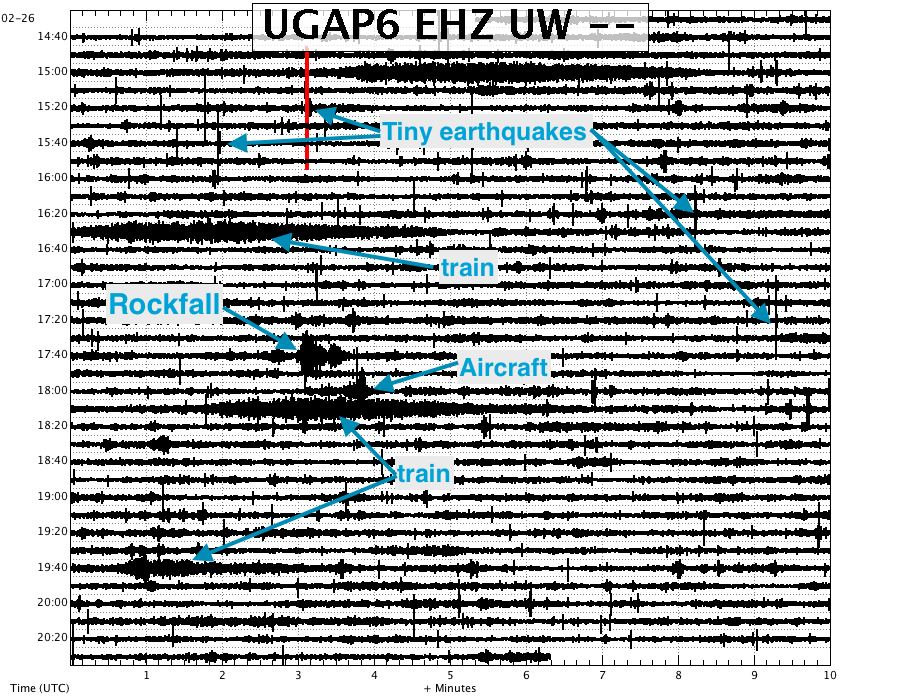
Note that it is strongest on UGAP6, the station actually out on the slide block. It is only slightly closer to the source than 5 or 2, so why does it seem so much stronger? We feel this may be because the seismic waves traveling directly through the slide block to this station are not as attenuated as those that must transition through the edges where the rock probably is not as competent. Again UGAP1 is contaminated by so much traffic noise (and is farther away) so this rockfall can not be discriminated. Recognizing rockfalls on 12 hour webicorders for this period is not easy, particularlly since after this event geologists were driving around the hill slope near our stations generating even more cultural noise. The following is a more detailed seismogram, easier to review, that we sometimes use in the lab where we can change scales and duration for a better view. Even then it is not imediately obvious what is a rockfall versus the many other types of signals.
Before leaving the topic of rockfalls we are a bit surprised that we have not seen more of these. We may be missing small ones, particularly those that take place during seismically noisy periods (wind or lots of traffic), but we don't think that rockfalls of the size of the one yesterday are being missed. Given that the slide has been moving about 1.7 feet per week for the past six or more weeks (and moving some for the previous two months) it seems that the total movement could be as much as 20 feet. One might expect that this movement would have dumped up to 20 feet off the edge of the slide into the quarry. This is a bit of a puzzle to this seismologist.
Enough of rockfalls. What about the more interesting (to a seismologist) tiny earthquakes that seem to continue at about the same rate. Our several monitoring techniques (listed at the beginning of this post) show little change over the period we have been watching; some ups and downs dependent on background noise levels but nothing that look to be significant changes in landslide events. However, over the past several days there does appear to be an increased number of cluster events as determined by REDPy. Below is a snapshot of part of the REDPy display showing events in each cluster as marks on a time line. Note that many near the top of the plot were all occurring in the past several days. These new clusters seem to be mostly in the same areas as previous clusters (along the east edge of the slide block) but may represent new points of failure along this edge.
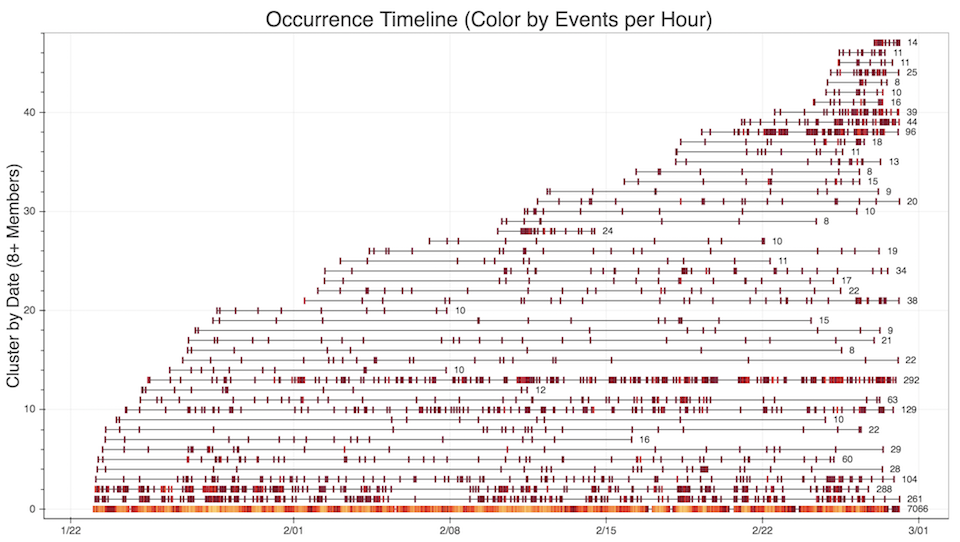
This appears to be a subtle change if it is a change at all. Other parameters we look at don't seem to indicate a change in total number of events, though a few recent events have been slightly larger than what we have seen before.
We plan to continue the monitoring in some form into the future. However, to save effort we may remove some of the seismic stations that are not providing useful information.
Update on March 16, 2018 (No change in the slide) The report from the engineers geodetically monitoring the landslide is that it is continuing to move at about the same rate as it has for the past two months; ~1.7 ft/week.
Update on March 26, 2018 (A little seismology science)
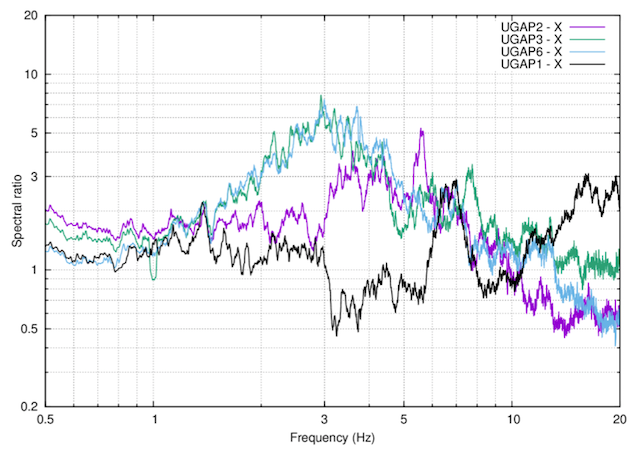
Monitoring the Rattlesnake Ridge landslide near Union Gap has become quite routine with little change in the motion from week to week. However, some interesting science may come from some of our seismic monitoring efforts. The PNSN seismic stations continue to record tiny earthquakes that seem to be coming from the east and north edges of the slide but are difficult to locate accurately. These stations have been useful for some more basic research on landslide studies. Jeff Moore from the University of Utah and Jan Burjánek from the Geophysical Institute of Czech Academy of Science in Prague have been using some of our data to look for resonance effects trapped within the slide body. Besides being able to diagnose several minor problems with instrument orientation and response calibration they have determined that there are waveform polarization and apparent resonances that are characteristic of slide blocks studied elsewhere. In particular our stations UGAP6 located on the slide block and UGAP3 just off the slide near the top seem to have similar responses from ambient noise sources and thus are seeing some of the same effects on seismic waves they record. Here I show a amplitude-frequency plot of the ratio of vertical to horizontal motion averaged over a period of ambient noise. Note that UGAP3 and UGAP6 are almost identical while UGAP1 and UGAP2 are quite different. (UGAP5 has problems with the horizontal components response that doesn't allow it to be used for this study.)
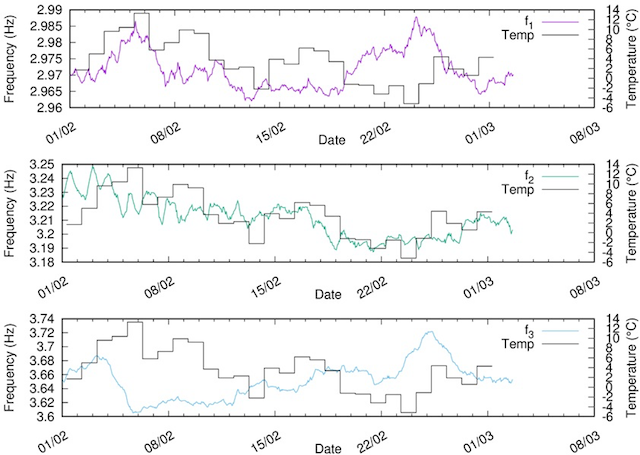
Jeff and Jan have been using these sort of data to watch for changes in resonance frequencies over time. Very subtle changes have been seen. Here I directly include part of their observations:
Jan has started tracking three resonant frequency peaks between 2-4 Hz on UGAP6 and the results show coherent but minimal drift over time. Would be consistent with the idea that not much new is happening with internal break up of the slide mass, at least in the area around UGAP6. I attach and image Jan produced showing frequency drift from Feb 1... small changes: 0.7% for f1, 1.8% for f2, and 3% for f3. For reference we see a few percent daily drift at some of our arch sites (but not all interestingly) directly related to ground and air temperature changes. This is why Jan is plotting drifts against temperature, as we also previously observed clear trends between the two at the Preonzo slide in Switzerland. Hard to distinguish what if any correlation there may be between the three frequencies or temperature. For now it seems the simplest idea is that there is little change in the data.
An independent effort at seismic monitoring has been underway for more than the past month by Amanda Thomas, a seismology Professor from the University of Oregon who has a set of individual small seismographs that she installed near the landslide. She has provided a preliminary report on her efforts that are included in a separate blog post.