The M9 Project (Part 2): Computer Models of a Megathrust Quake
In the previous blog post about The M9 Project, we talked about how the Cascadia Subduction Zone can generate an M9.0 earthquake. However, our understanding of what an earthquake of this scale would actually look like is less advanced. While we have evidence of past earthquakes (e.g., native oral histories, tsunami records), we have no quantitative observations of how strong the shaking would be during a megathrust earthquake in the Pacific Northwest.
To address this problem, researchers with The M9 Project used 3D computer simulations to help understand what 50 different realizations of an M9.0 earthquake could look like in Cascadia. To create these simulations, The M9 Project researchers used multiple supercomputers: Stampede (University of Texas - Austin), Constance (Pacific Northwest National Lab), and Hyak (University of Washington). A single earthquake simulation took up to 46 hours to complete. If it was possible to run these earthquake models on a personal computer (many of which have a mere 2 processors, compared to the 576 processors used to run these simulations on a supercomputer), it would take about 522 days to complete one simulation.
Why are earthquake simulations important?

The unique properties of the Cascadia Subduction Zone prevents a side-by-side comparison between a future Cascadia earthquake, and other earthquakes that have occured around the world. For instance, an M9.0 earthquake in Japan, Chile, or Indonesia may look very different from an M9.0 in the Pacific Northwest.
Scientists have developed equations that can estimate the strength of ground shaking based on an earthquake’s magnitude and a specific location’s distance from the fault. However, these equations still rely on averages, and do not fully account for location specific 3-D effects (i.e., “How will seismic waves bounce around in the Seattle basin?”). Conversely, the supercomputer earthquake simulations, while still having some unknowns, can estimate shaking at every point in the Pacific Northwest, and are specific to the geologic conditions of the Cascadia Subduction Zone.
How are these earthquake simulations created?
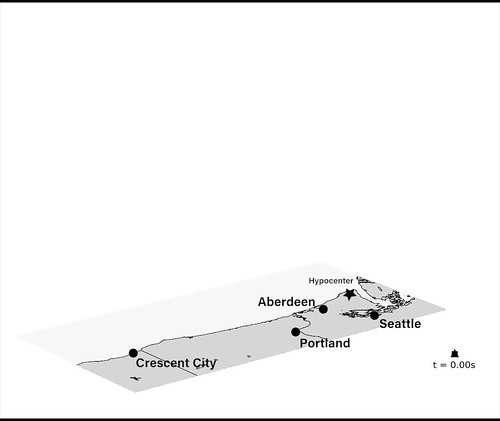
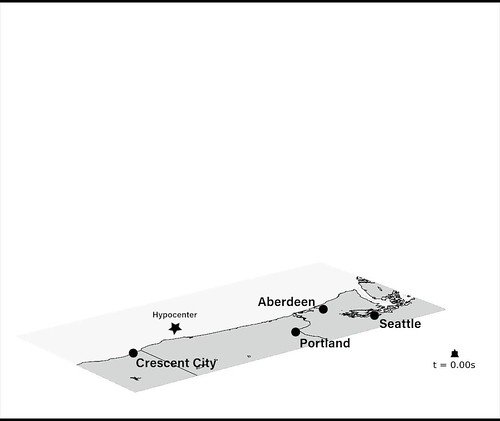
Out of an infinite number of possibilities, 50 simulations of an M9.0 earthquake were run by The M9 Project team. The individual earthquake scenarios had a few important variations between them, that made each earthquake source unique: (1) the hypocenter location (i.e., where the earthquake starts), (2) how far inland the rupture extends (i.e., how close the earthquake gets to major inland cities, such as Seattle), (3) the location of “sticky patches” on the fault, that generate the strongest ground shaking, and (4) the slip distribution on the fault (i.e., how far certain areas on the fault move during the earthquake).
Are certain earthquake scenarios “better” or “worse”?
The area affected by a megathrust earthquake is large enough that the outcome is going vary by location. A “best-case” scenario for one area in the Pacific Northwest could be a “worst-case” scenario somewhere else in the region.
One of the results of the computer simulations showed that when an M9.0 earthquake occurs on the Cascadia Subduction Zone, less violent shaking may be felt closer to the epicenter. This is because an earthquake on the Cascadia Subduction Zone will not occur at a single point -- instead, it will rupture a very large area. As the rupture moves along the fault, the seismic waves will start to “pile up,” similar to the Doppler Effect.

As the waves at the front of the rupture combine, their amplitudes get larger and create more violent ground motion. Therefore, locations closer to the hypocenter may receive less complex and destructive seismic waves than locations that are farther along the rupture and experience this “piling-up” of seismic energy.
In these two videos, notice how Seattle's mock seismogram has larger spikes (which denotes stronger ground motion) when the earthquake source is farther south, and the fault ruptures north.
This variation by location makes it virtually impossible to award a scenario the title “best-case” for the entire Pacific Northwest.
Can we do even better?
These computer simulations are the most accurate representations of what an M9.0 earthquake would look like in the Pacific Northwest. Unfortunately, there is a lot of variability in these calculations because there are still too many unknowns. An increase in seismic and GPS instrumentation throughout the Pacific Northwest, especially offshore, will help us identify more specifics about the Cascadia Subduction Zone and improve future computer simulations. For instance, we may be able to determine where “sticky patches” are located on the fault and obtain a more detailed image of the 3D structure of the subduction zone. Further constraining these variables in the computer simulations will ultimately help us refine our estimates of seismic hazards in the Pacific Northwest.
Special Thanks To
Dr. Erin Wirth, UW Affiliate Assistant Professor
M9 Simulation coverage from UW News